Why is Black Friday won in Q1, not Q4?
Top-quartile brands don't switch on upper-funnel spend for peak, they hold it above 20% all year round. Here's the client data behind why Q4 is won early.
All
Learn More

Marginal ROAS shows what your next dollar is likely to return, which an average can hide. Here is how to read it and why your best channel may not deserve more budget.
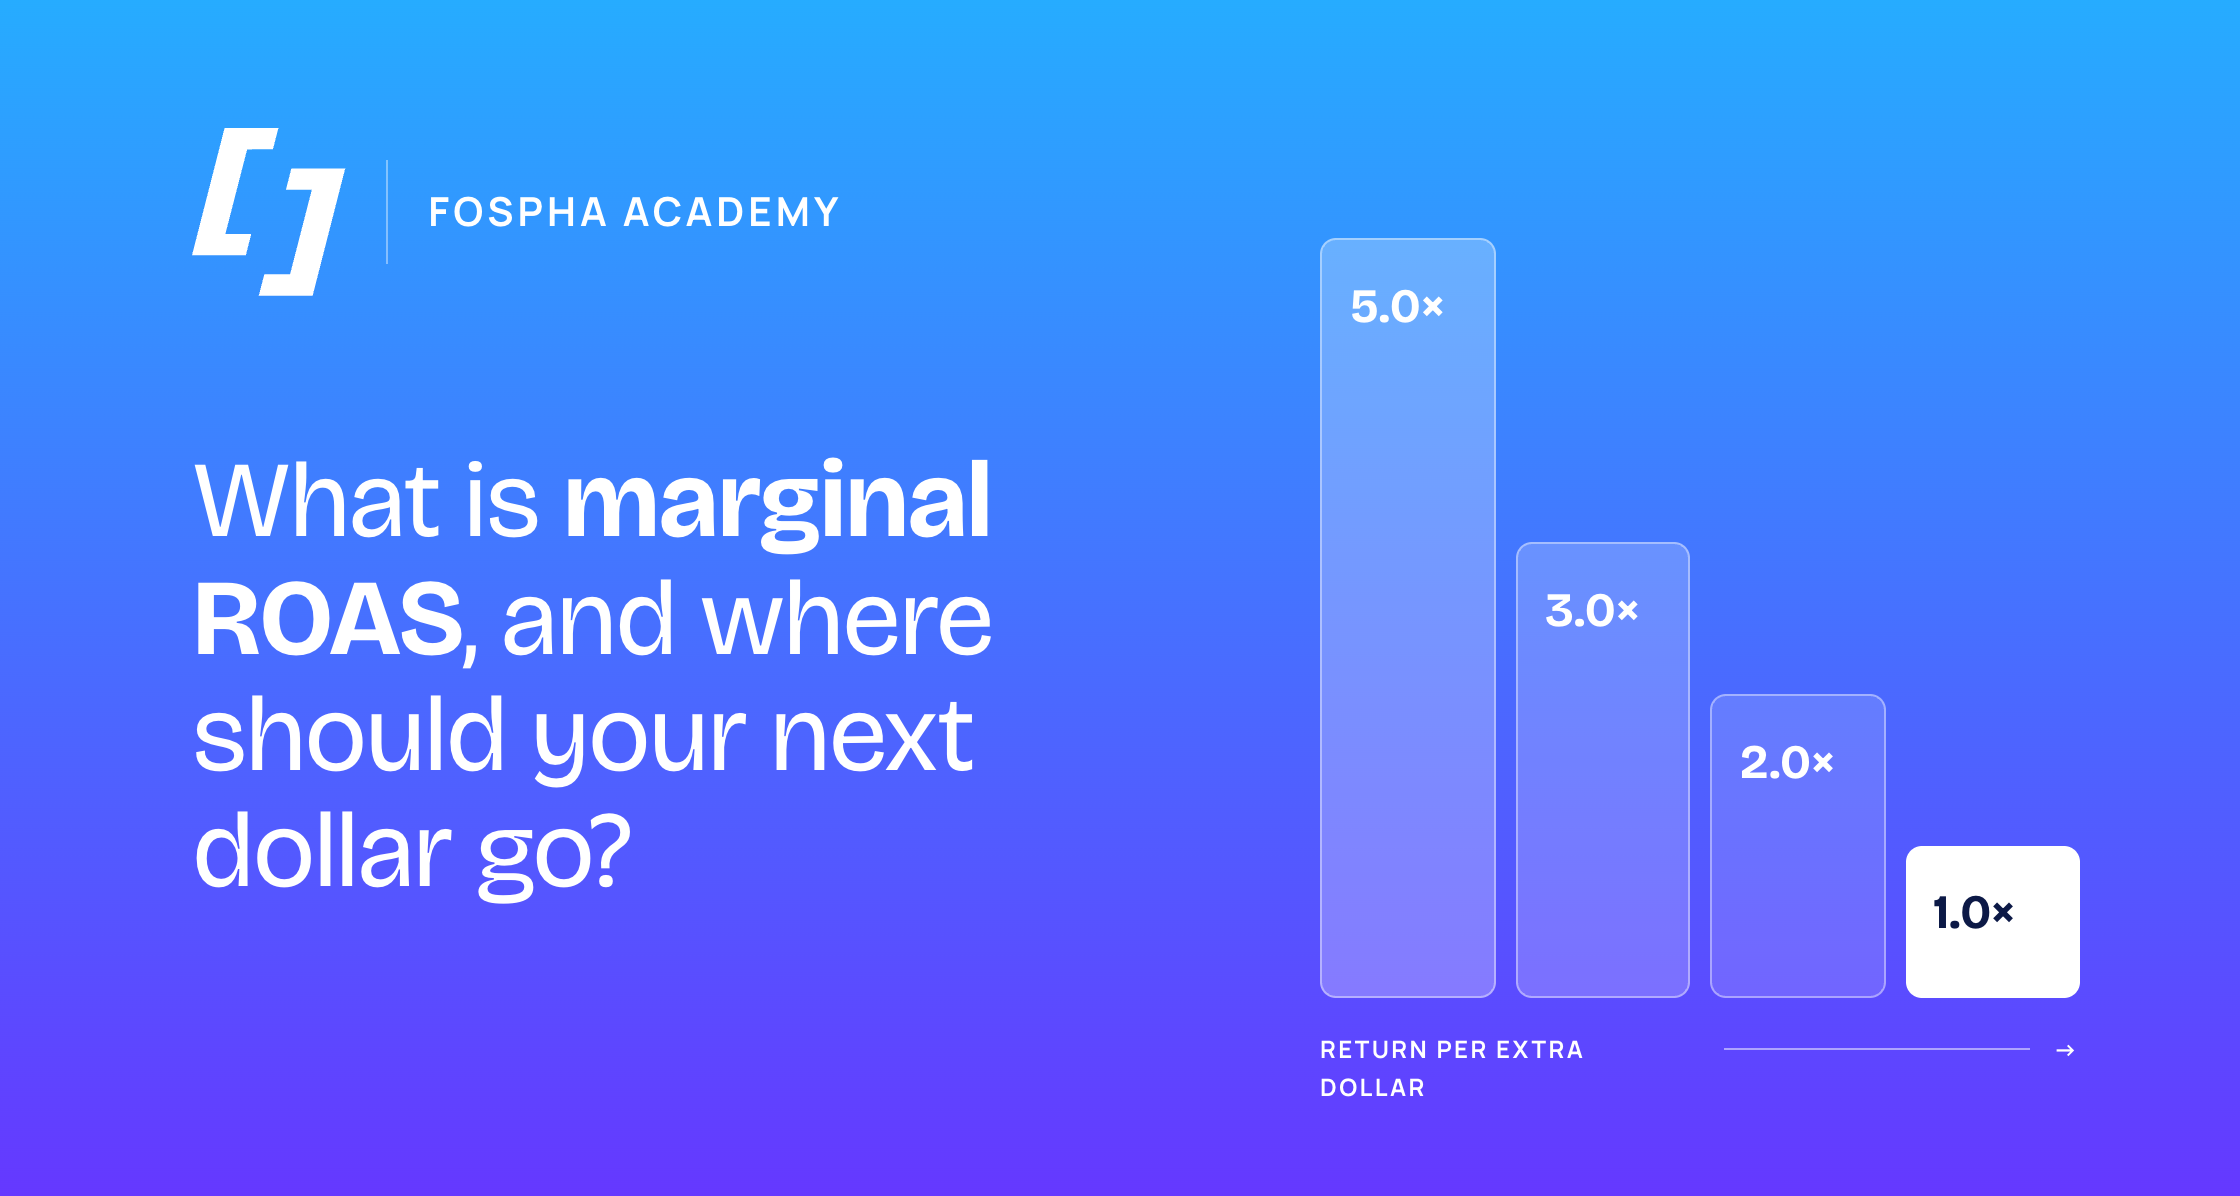
Marginal Return on Ad Spend (marginal ROAS) is the extra revenue you can expect from the next dollar you put into a channel, at your current spend level. Marginal ROAS is a model-based estimate, usually read from a response curve, and it is the number that guides where additional budget should go.
Picture the planning meeting. Paid social shows the strongest Return on Ad Spend (ROAS) in the account, finance has approved an extra $20,000 for next month, and the instinct is to give it to the top performer. That instinct rests on an average. A channel can report a healthy average while its last few thousand dollars barely pay back, and a channel with a modest average can still have room to grow.
Marginal ROAS answers the question on the table: if we add or cut budget here, what happens next? It also gives you a defensible number to take back to finance. When money moves away from your best channel, you can show what the latest dollars in that channel returned and what the next dollars elsewhere are expected to return, instead of leaning on an average that hides the difference.
Average ROAS looks back across all spend, while marginal ROAS looks at the next increment. Average ROAS is total revenue divided by total spend. Marginal ROAS is the change in revenue divided by the change in spend, measured at your current budget. On a chart, it is the slope of the response curve at the point where you are standing today.
The two drift apart because most channels saturate. Early dollars tend to reach the people most ready to purchase. As spend grows, extra dollars reach people who are less ready to buy, or the same people more often. Total revenue keeps rising, but more slowly, so marginal ROAS falls faster than the average. That is why average ROAS suits reporting on what happened, and marginal ROAS suits deciding what to do next.
Email send frequency is a familiar comparison. The first campaign of the week to a list usually earns well. A fourth send in the same week earns less and may start costing unsubscribes. Revenue per send across the week can still look healthy. The decision in front of you is whether to add a fifth send, and that depends on what the fifth send will earn.
Average and marginal ROAS can point in opposite directions. The figures below are invented to show the mechanics and are not benchmarks. They represent incremental revenue (sales that would not have happened without the ads) estimated from a response curve.
| Channel A weekly spend | Incremental revenue | Average ROAS | Marginal ROAS on the latest $10,000 | How the marginal number is worked out |
|---|---|---|---|---|
| $10,000 | $50,000 | 5.00 | 5.00 | ($50,000 − $0) ÷ ($10,000 − $0) |
| $20,000 | $80,000 | 4.00 | 3.00 | ($80,000 − $50,000) ÷ ($20,000 − $10,000) |
| $30,000 | $100,000 | 3.33 | 2.00 | ($100,000 − $80,000) ÷ ($30,000 − $20,000) |
| $40,000 (today) | $110,000 | 2.75 | 1.00 | ($110,000 − $100,000) ÷ ($40,000 − $30,000) |
How to read the calculation
Now compare a second channel. Channel B spends $10,000 a week today and returns $25,000, an average ROAS of 2.5. The model estimates that the next $10,000 would add $28,000, a marginal ROAS of $28,000 ÷ $10,000 = 2.8.
On averages, Channel A (2.75) beats Channel B (2.5). At the margin, the picture flips. The latest $10,000 in Channel A returned about $1 per dollar, while the next $10,000 in Channel B is expected to return about $2.80.
Suppose contribution margin is 40%, meaning 40 cents of every sales dollar is left after product and delivery costs, before ad spend. Break-even ROAS is then 1 ÷ 0.40 = 2.5. Channel A’s average (2.75) clears that bar, but its latest tranche (1.00) is well below it and is likely losing money. Moving $10,000 from Channel A to Channel B would give up about $10,000 of revenue and add about $28,000, a net gain of roughly $18,000 at the same total spend.
The logic also runs the other way. Nielsen’s ROI Report found that 50% of planned media channel investments were too low to reach maximum return, with a median under-investment of 52%. A low average does not always mean a channel is full, and a high average does not always mean it deserves more.
Marginal ROAS is estimated rather than observed. Ad platform reports show the result of the spend you ran, so they cannot show what a different budget would have done. Teams typically read marginal ROAS from a response curve fitted by a Marketing Mix Model (MMM), a statistical model that estimates each channel’s contribution to revenue while allowing for carryover, seasonality and saturation. The Interactive Advertising Bureau’s December 2025 guide to modernizing MMM recommends that outputs start from the question “Where should we spend the next $1?” It also reminds readers that the outputs are model estimates and suggests pairing them with confidence ranges before large budget moves.
Spend-change experiments, where budget rises or falls in some markets and results are compared, can also help calibrate the curves a model produces.
Two cautions follow. First, marginal ROAS inherits the strengths and blind spots of the revenue beneath it. A curve built on platform-reported or last-click revenue carries those limits into its slope. Second, revenue scope matters. A curve built on website sales alone may understate channels that also drive sales on marketplaces or in store, so the revenue behind the curve matters as much as the model. Curves also move with creative, seasonality and competition, so last quarter’s reading may not describe this week.
In Fospha, incremental forecasting shows which channels are close to saturation and which have real headroom to scale, within a confidence interval, and its forecasts are back-tested against real outcomes.
Most ROAS types differ in which revenue they count, while marginal ROAS differs in where on the curve you take the reading. Average and marginal are two readings of the same curve, so a team can track an average and a marginal figure for incremental ROAS, or for Total Commerce ROAS. Platform bidding targets work on averages. Google Ads’ target ROAS setting, for example, aims for an average conversion value per dollar spent.
| ROAS type | What it measures | Strengths | Blind spots | Best use |
|---|---|---|---|---|
| Platform-reported ROAS | Revenue a platform credits to its own ads within its attribution window | Fast, granular, feeds bidding | Each platform credits itself, so totals across platforms can overlap | Creative and bid tuning inside one platform |
| Last-click ROAS | Revenue credited to the final click before a purchase | Simple and consistent | Gives no credit to earlier touchpoints that built demand | Quick checks on lower-funnel activity |
| Blended ROAS or Marketing Efficiency Ratio (MER) | Total revenue divided by total ad spend (MER often uses total marketing cost) | Reconciles to the profit and loss statement | Shows no channel-level detail | Business trend and board reporting |
| Attributed (full-funnel) ROAS | Revenue assigned to channels by a cross-channel model | A channel view across the whole funnel | Depends on the model’s assumptions | Comparing channel contribution day to day |
| Incremental ROAS (iROAS) | Revenue that would not have happened without the ads, averaged across spend | Built from experiments designed to isolate the effect of ads | Usually an average for the period tested | Checking whether a channel adds sales |
| Total Commerce ROAS | Revenue across your website, Amazon, TikTok Shop and other sales destinations, divided by ad spend | Counts sales beyond the brand’s own site | Needs modeling to link ads to marketplace sales | Brands that sell in several places |
| Marginal ROAS | Return on the next dollar at current spend | Speaks directly to where extra budget should go | A model estimate with a range, and curves shift over time | Adding, holding or moving budget |
What is Media Mix Modelling (MMM) and how does modern MMM work?
The three stages of adopting AI in marketing measurement