Measurement that changes what happens next.

future.

economy.

company.

Most measurement has an actionability gap. Fospha closed it. Meet the Measurement OS integrated at the heart of the stack — every ad, every marketplace, delivering thousands of incremental outcomes for leading retail commerce brands, every day.
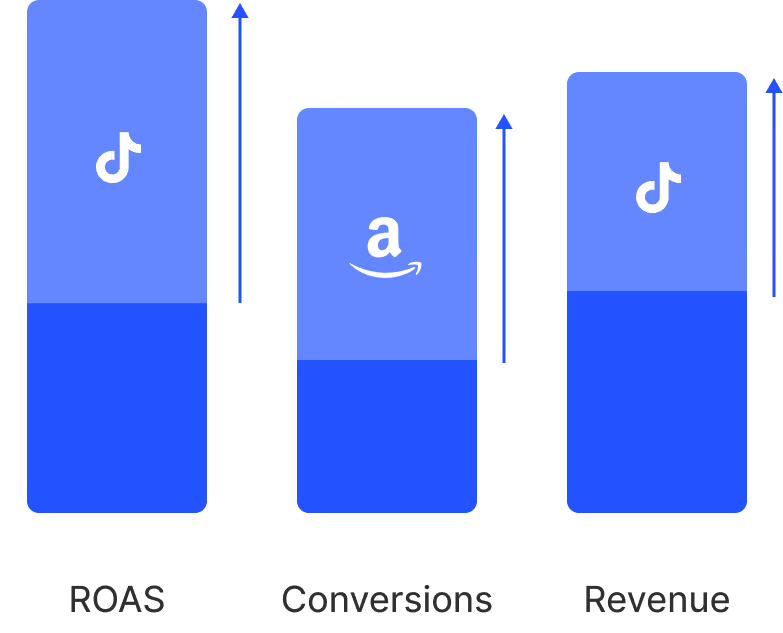

Comparison bar chart showing that TikTok users spend 55 minutes per day, Amazon users spend 35 minutes per day, and Twitter users spend 30 minutes per day on their apps.
Light blue hard-shell suitcase with a black handle and wheels next to a blue roll-top backpack.
Bar chart comparing volume to target across four categories labeled by icons: chat, email, alert, and question mark, with blue bars representing volume and purple bars representing target.
Scatter plot showing a positive correlation between Spend and Revenue with a blue trend line and shaded confidence interval.
Young woman wearing a light blue cap and white top with mesh detail, standing outdoors with a cityscape background.Urban Outfitters logo text.
Comparison bar chart showing that TikTok users spend 55 minutes per day, Amazon users spend 35 minutes per day, and Twitter users spend 30 minutes per day on their apps.
Two Laura Geller makeup brushes and three open compacts with marbled powder and blush shades on a white background.Laura Geller brand logo with the text 'Laura Geller New York' in a modern, minimalist font.
Bar chart comparing volume to target across four categories labeled by icons: chat, email, alert, and question mark, with blue bars representing volume and purple bars representing target.
Scatter plot showing a positive correlation between Spend and Revenue with a blue trend line and shaded confidence interval.
Four women standing in colorful Gymshark activewear and white sneakers against a plain beige background.Gymshark
Close-up of a modern Dyson bladeless air purifier with bronze and silver finish and a digital display showing 'AUTO' mode.Dyson brand logo in black text on a white background.
Bar chart comparing volume to target across four categories labeled by icons: chat, email, alert, and question mark, with blue bars representing volume and purple bars representing target.
Comparison bar chart showing that TikTok users spend 55 minutes per day, Amazon users spend 35 minutes per day, and Twitter users spend 30 minutes per day on their apps.
Man and woman standing on a city street; woman wears denim shorts, striped shirt, and navy blazer, man wears white sweater vest and beige trousers.GANT brand logo in black uppercase letters on a white background.
Scatter plot showing a positive correlation between Spend and Revenue with a blue trend line and shaded confidence interval.
Woman in white sports bra and patterned leggings doing a one-arm dumbbell row on the floor.Black bold uppercase text reading 'SWEATY BETTY'.
Bar chart comparing volume to target across four categories labeled by icons: chat, email, alert, and question mark, with blue bars representing volume and purple bars representing target.
Comparison bar chart showing that TikTok users spend 55 minutes per day, Amazon users spend 35 minutes per day, and Twitter users spend 30 minutes per day on their apps.
Five Nécessaire skincare products including The Body Exfoliator, The Body Serum, The Deodorant, The Body Wash, and The Body Lotion, arranged against a white background.Open light beige toiletry bag with brown leather zipper pull on a reflective surface.
Scatter plot showing a positive correlation between Spend and Revenue with a blue trend line and shaded confidence interval.

Brands on Fospha's Measurement OS achieve 30% higher ROAS than the market

Fospha gives brands the insight to optimize what’s working today - and the confidence to invest in what drives incremental growth tomorrow. Delivering smarter decisions and stronger returns.

Measurement rebuilt for the rate decisions get made.

Integrated to fill the gaps left by legacy tools.
Calibrated to move beyond correlation.
Corrected for the bias built into click-based measurement.
Most brands are running a fragmented stack: GA4 for daily decisions, a quarterly MMM for planning, occasional incrementality tests for big bets. None of it connects. None of it covers marketplaces. None of it closes the loop between measurement and action. Fospha brings it all together in one complete system: every channel, every marketplace, every day. One number your whole team can build and automate from.

Traditional Marketing Mix Models

Fospha's Media Mix Model

Pure correlation

Beyond correlation

Quarterly reports

Daily outputs

Channel-level view

Ad-level granularity

Historical and static

Predictive forecasting

Manual interpretation

Automation-ready

Black-box models

Transparent science

One Measurement OS to report, plan, and optimize across every ad, everywhere you sell, every day.

Measure the full impact of every ad — web, Amazon, TikTok Shop and beyond, daily.
Have the proof to do something completely new, from insight to incremental impact. Automatically.

Core
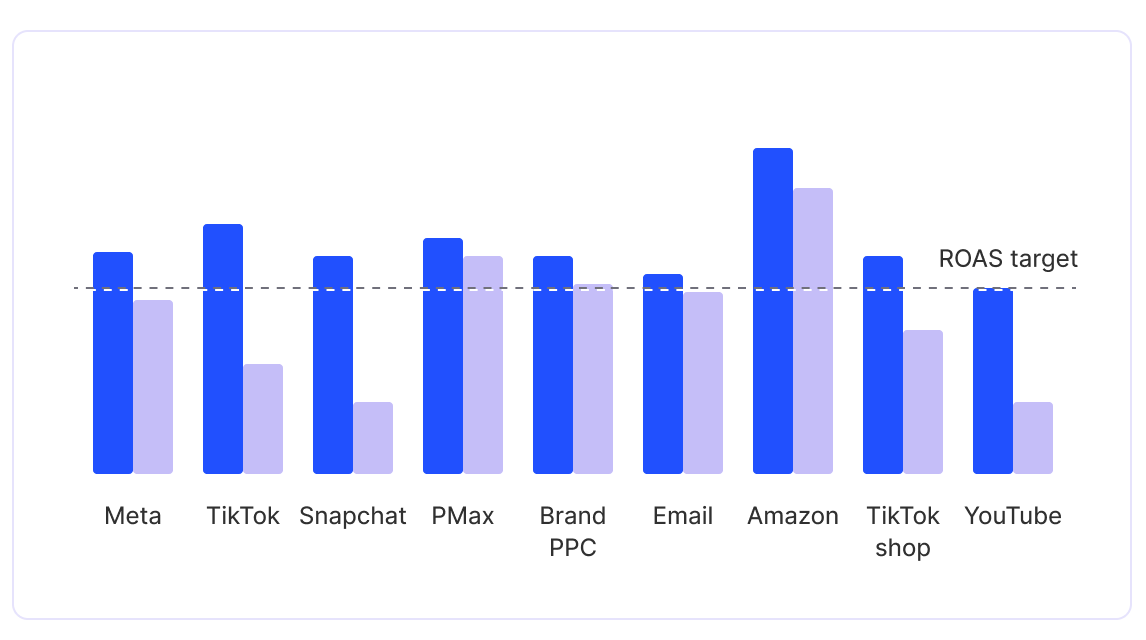
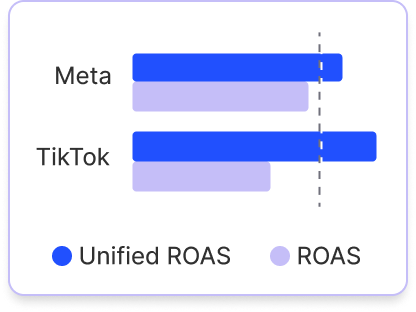
Bar chart showing ROAS performance for Meta, TikTok, Snapchat, PMax, Brand PPC, Email, Amazon, TikTok shop, and YouTube, with two bars each comparing actual ROAS against target, and a dashed line indicating the ROAS target.

Daily, ad-level measurement that flows directly into the systems that act on it

Spend smarter, grow faster. Fospha's always-on Daily MMM provides tools for all teams - from CMO to channel manager.

Measure and quantify the impact of every impression, view, and click from campaign down to ad-level, across all your sales channels like DTC, Amazon, and TikTok Shop. Fospha delivers strategic insights daily to help brands optimize for short and long-term efficiency.

Beam
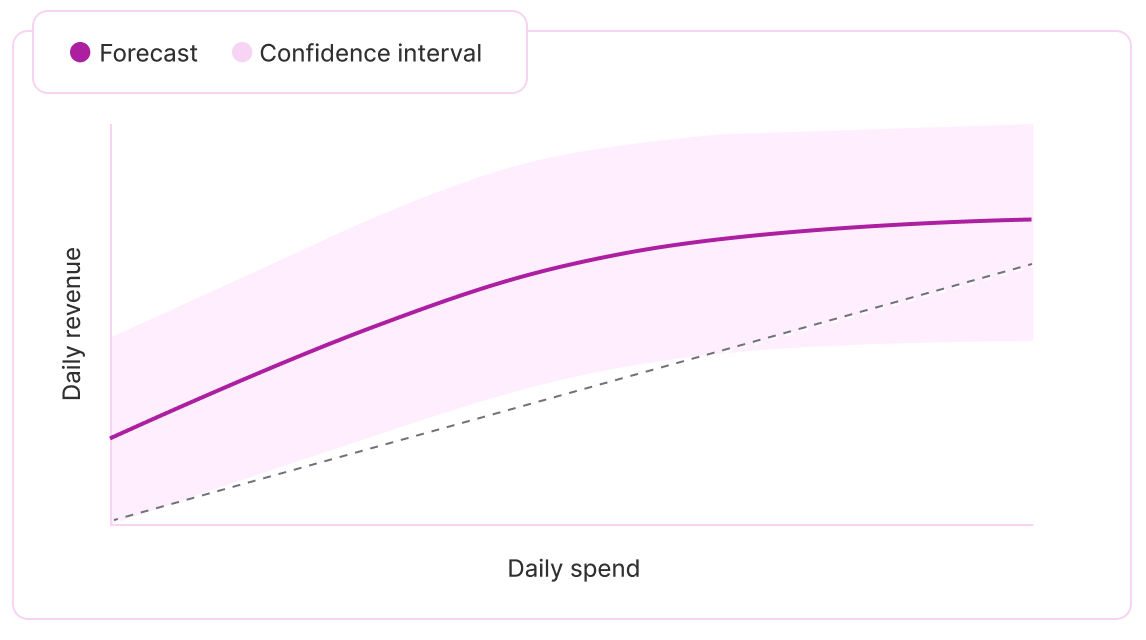
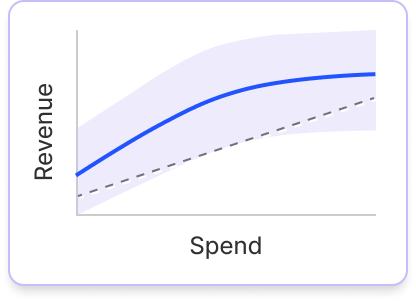
Line graph showing forecasted daily revenue increasing with daily spend, with a confidence interval shaded in light purple around the forecast line.

Know your next best dollar — forecast incremental returns

Identify and harness opportunities for profitable growth with Bayesian saturation curves for every channel and objective so you can see exactly how far your budget can go before you spend it.

Forecast ROAS and CAC at different investment levels, pinpoint the point of diminishing returns, and maximize the impact of your marketing budget.

Halo
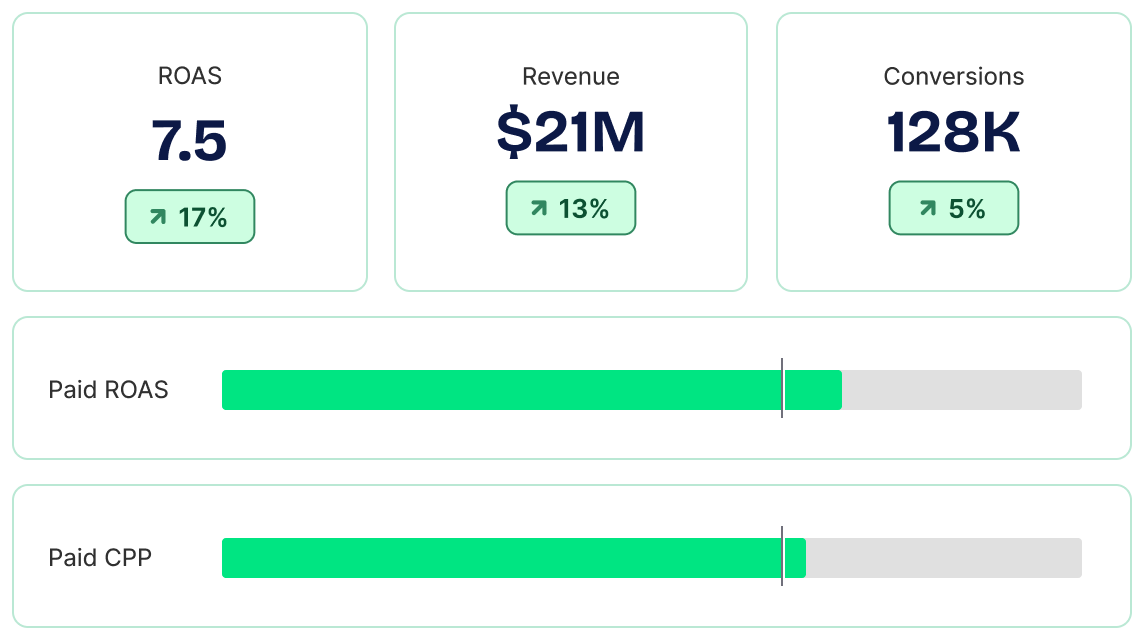
Dashboard showing Unified ROAS 7.5 up 17%, Unified revenue $21M up 13%, Unified conversions 128K up 5%, with progress bars for Unified paid ROAS and Unified paid CPP.

One system — DTC, Amazon, and TikTok Shop

Measuring the cross-channel halo effect on marketplaces is impossible using DTC metrics and tools. Without unified measurement, media budgets miss crucial marketplace revenue.

Halo leverages incremental forecasting models to measure how your paid media drives sales across Amazon, TikTok Shop, and retail marketplaces. Optimize marketplace performance and drive profitable growth.

Prism

Turn measurement into automated action

Prism delivers incremental growth at scale, especially in channels and markets that get deprioritized when teams are stretched.

Budget changes reflect the full cross-channel impact of your marketing, not just ad platform reporting, so spend never shifts based on silo’d signals.

Channel efficiency improves automatically — Prism reduces budgets when performance drops, so no dollar stays in an underperforming campaign longer than it should.

Fospha AI

Ask Fospha AI

Ask your Fospha data anything. Get answers to your performance questions directly in the Fospha dashboard, or connect your data to the AI tools you already use with our MCP.

Inside Fospha, it's your in-dashboard marketing strategist. Ask any performance question and get the answer the moment you need it.

Outside Fospha, plug your measurement into the AI tools your team already uses — like Claude or ChatGPT. Build a workflow once and have a report land in your exec team's inbox every week.

The science that makes trust possible and action inevitable.

Over a decade of R&D, built by the same team using the same methodology that has powered growth for Gymshark, Huel, Dyson, and hundreds of the world's fastest-growing retail brands. The result is a proprietary, always-on measurement system with a Media Mix Model at the core, delivering what legacy tools can't: daily, impression-led, full-funnel measurement that is transparent, validated, and ready to power automation.

Scientific Rigor
High Frequency
Market Context Applied
Signal Loss Free

End-to-end. Every team. Every decision. Driving incremental outcomes, every day.

Our Measurement OS unites Finance, Marketing, Data, and Leadership with a shared view of performance and profitability — combining daily measurement, forecasting, and optimization.

Maximize the impact of your marketing budget

Marketing is more complex than ever, leading to analysis paralysis and fewer smart decisions. Fospha simplifies this complexity.

See the true impact of all your marketing activity across every sales channel, pinpoint where you have room to grow profitably, and make the most of every dollar in your marketing budget

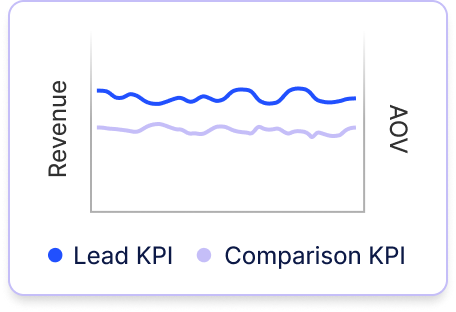
Understand your true marketing ROI for smarter spending

Traditional measurement tools bias towards bottom-of-funnel channels, making it difficult to identify true revenue drivers across the full channel mix and allocate budget accordingly.

With Fospha, see the true ROI of all your channels, make smarter budget decisions, and escape the bottom-of-funnel trap.

With automatic, customized reporting directly in your inbox, monitoring the metrics that matter has never been easier.

Prove True Channel Impact, Optimize Every Dollar

Fospha’s always-on MMM delivers the daily, ad-level insights you need to stay agile and optimize.

Instantly spot trends in your data, course-correct quickly, and identify both oversaturated campaigns and top performers with headroom to scale.

Maximize performance and make the most of every dollar in your channel budget.

Prove the business impact of brand. Secure future growth

Brand marketers know brand-building is a long game - but without early indicators of impact, brand budgets are the first to be cut when spending tightens.

Fospha’s Glow leverages causal reasoning modeling to measure the impact of brand campaigns on the sensitive leading indicators of future performance.

Quantify the impact of brand-building on tangible business outcomes, justify budgets and fuel long-term growth
CMO
CFO
CHANNEL MANAGER
BRAND MANAGER

How we embed the Measurement OS
at the heart of your business.

Where evolved measurement enables strategic planning, team alignment, and execution.

1. Data validation

We begin by establishing a solid data foundation. Our privacy-safe approach ensures your marketing data is accurately captured, reconciled, and fully reflective of your true performance, creating the reliable baseline needed for strategic decisions.

2. Total measurement visibility & growth planning

We’re a ‘glass box’ provider. You’ll be shown a step by step breakdown of your data at every stage of our modelling, so you can be confident in understanding your outputs.

You gain access to our enterprise-grade model we've pressure-tested across hundreds of retailers. Always-on media mix modeling. Daily training. Ad-level granularity.

This provides both upper and lower funnel visibility, revealing the true impact of your marketing strategy and enables us to develop a mutual success plan that balances short-term wins with long-term sustainable growth.

3. Change management & adoption

Change is difficult. We get that.

We help unite marketing and finance teams around a shared source of truth, facilitating the transition to a new view of measurement. Through regular training sessions, reporting workflows, and optimization insights, we ensure everyone understands the value of daily measurement and can confidently act on the data.

4. Continuous learning
& growth

Our partnership extends beyond implementation. We help you design and interpret experiments to validate key hypotheses, continuously optimise your strategy, and confidently scale what's working.

By connecting Fospha to your tools and workflows, teams across your organisation—from CMO to channel managers—can make smarter, more confident budget decisions that fuel profitable growth.
Cross-team alignment
Causal decision-making
Full-funnel growth
Lower cost per sale
Lower new customer cost
Increase Unified ROAS

Hundreds of leading retail brands trust Fospha's Measurement OS

From scaling DTC brands to global enterprise retailers — Fospha's Measurement OS delivers the daily signal teams trust for their most important budget decisions.
Read our clients’ success stories
"Fospha is the most important tool in our marketing stack. By using Fospha to guide spend, Huel grew new customer revenue by 54% in just 6 months."
Ollie Scheers
CTO
"Fospha gives us a level of insight that click-based measurement just can't provide. With Fospha's data we can make faster decisions, push budgets further, and get better results."
Olly Hudson
CMO
Fospha has been super helpful in helping Nest clients understand the value of social, upper funnel investment and emerging channels like TT, Pin and Snap."
Luke Jonas
Co-Founder
“Fospha has been a game changer for understanding how our paid media channels are performing.”
Will Wilkie
Senior Digital Marketing Manager
“Fospha has become a crucial part of how we guide strategy and make investment decisions—especially in upper-funnel channels like YouTube. It helps us clearly connect media spend to business outcomes, and that clarity plays a part in helping unlock investment and confidence across the business.”
Elvis Mugera
Paid Media Lead, River Island
"Fospha empowers brands to unlock extraordinary growth by quantifying hidden opportunities and delivering daily, actionable insights. It enables you to invest your media spend where it truly matters - reducing inefficiencies and driving transformative results."
Dan Sava
Founder
"Introducing an impartial, full-funnel tool to come in and 'mark Google's homework' really helped us justify our increased investment in PMAX & Paid Search. We report on Fospha numbers weekly in our exec meetings now."
Jamie Degiorgio
Head of Performance Marketing
“We knew Snapchat had value but we couldn’t really prove it. With Fospha, we finally had the visibility we needed to invest in Snapchat. Now it's one of our top-performing channels.”
Sean Carpenter
Head of Digital Marketing
"Glow was the missing piece of the puzzle for us in understanding why AOV was moving in ways we had never been able to explain before. It has absolutely shaped the way we think."
Jon Grail
Director of Growth
"Halo really helps us with overall with event planning, campaign planning, and investment choices. It provides data that previously was a gap for us, so we can better plan and promote a key sales channel."
Calvin Lammers
GM of Digital
"Fospha gave us the data confidence we needed. For the first time, we could clearly see how our TikTok Shop spend was influencing performance across our business."
Phoebe Powell
Paid Social Strategist
‍“Every time management challenged the numbers, I could open Fospha to prove what was really happening. Over time, Fospha became our source of truth for digital performance.”
Rabee Sabha
Digital Marketing Manager

Stay ahead with the inside scoop from Fospha.

For over 10 years, we've been leading the change in marketing measurement.

Ready to know where to grow next?

See where to grow next

FAQs

How to choose a marketing measurement platform: a practical guide for retail CMOs

Quick answer: Choosing the right marketing measurement platform depends on your commerce model, measurement maturity, and how your team uses data operationally. This guide walks through four stages of measurement maturity - from last-click attribution to fully automated execution - with specific capabilities to evaluate and questions to ask any vendor before committing. It is designed for retail and ecommerce CMOs running significant paid media budgets across multiple channels and sales destinations.

Every measurement vendor will tell you they are the right choice. Most of them are not wrong, for someone. The question is whether they are right for you, at your stage of measurement maturity, with your channel mix and commerce footprint.

The brands that make the best measurement decisions in 2026 are not necessarily those with the biggest budgets or the most sophisticated tools. They are the ones that are honest about where they are today, clear about what decision-making capability they need, and disciplined about choosing a platform that fits their operational reality - not their aspirational one.

This guide is designed to help you think through that choice. It is organized around four stages of measurement maturity that we observe across retail brands. Each stage has a different primary problem, a different capability requirement, and a different set of questions worth putting to any vendor.

If you are looking for a full breakdown of the leading privacy-safe measurement tools available in 2026, that is covered in the companion piece: Top 7 Privacy-Safe Marketing Measurement Tools for Retail Brands in 2026

Why measurement platform decisions are harder than they look

Most platform evaluation processes start in the wrong place. They start with a features comparison, a pricing conversation, or a demo from whichever vendor responded fastest to your LinkedIn message.

The better starting point is a clear-eyed assessment of what is broken in your measurement today, and whether the gap is a tool problem or an operational one.

The most common failure modes we observe are not technical. They are:

  1. Conflicting numbers that prevent alignment. Marketing reports one ROAS. Finance calculates a different one. Leadership sees a third version in the board deck. The conversation becomes about the numbers rather than about the growth strategy. No measurement tool fixes this if the underlying problem is that different teams apply different logic to the same data.
  2. Insights that arrive too late to act on. A quarterly MMM is genuinely useful for annual planning. It is not useful for deciding whether to shift budget from Meta to TikTok this week, or whether the creative you launched on Monday is already fatiguing. The cadence of the insight needs to match the cadence of the decision.
  3. Measurement that stops at the homepage. For brands selling across DTC and marketplaces, a tool that only measures what happens on your website is measuring a fraction of the business. The halo effects of paid social on Amazon revenue, or the downstream conversion impact of TikTok awareness, are invisible to pixel-based tools. Decisions made without that data are structurally incomplete.
  4. Accurate numbers that nobody acts on. This is the measurement failure that gets discussed least. A dashboard that everyone nods at and nobody acts on is an expensive reporting cost. The right question is not "is this accurate?" - it is "does this change what we do?"

With those failure modes in mind, here is how to think about where your organization sits today and what you need next.

Stage 1: You are still on last-click attribution or GA4 as your primary source of truth

What is typically happening at this stage

You have data. You probably have quite a lot of it. The problem is that the data is telling different stories depending on where you look. Your Meta ads manager shows strong ROAS. Google Analytics tells a different story. Your finance team has a third number derived from revenue reporting. None of them reconcile cleanly.

The operational consequence is that budget conversations become defensive. You are spending more time explaining why the numbers differ than deciding where to invest. Upper-funnel channels - paid social, YouTube, display - are consistently under-resourced because the data that exists does not adequately capture their contribution. The channels that look good in last-click reporting get more budget. The channels that build demand upstream of the last click get cut or held flat.

This is a structural feature of last-click attribution: it rewards the last touch and ignores everything that preceded it. For brands running any meaningful investment in awareness or consideration channels, this creates a systematic bias in budget allocation over time.

What you need at this stage

The primary requirement is a single, trustworthy view of performance that both marketing and finance can operate from. Not a more sophisticated model, necessarily - though that matters too. What matters most at this stage is that the output is reconcilable with actual revenue, explainable to non-technical stakeholders, and consistent enough that it stops generating internal debate.

Transparency is more important than sophistication at Stage 1. A glass-box model that finance can interrogate and agree to operate from is worth more than a technically superior black-box model that generates scepticism every time it produces an unexpected result.

Capabilities to evaluate

  • Revenue reconciliation. Can the platform's outputs be traced back to actual business revenue in a way that finance can verify? Ask the vendor to walk you through how reported incremental revenue is calculated and how it relates to your P&L.
  • Cross-channel consistency. Does the platform produce a single version of performance across all channels - rather than requiring you to manually aggregate channel-level reports that each use different attribution logic?
  • Stakeholder accessibility. Can a finance director or CFO understand the methodology without a data science background? The measurement that drives decisions is the measurement that everyone in the room can follow.
  • Impression-level measurement. Does the platform give appropriate credit to upper-funnel channels based on impressions and views, not only clicks? This is one of the most common structural gaps in last-click stacks.

Questions to ask vendors at this stage

  • How do your outputs reconcile with revenue we can verify in our finance systems?
  • Can you show us, in plain language, how the model assigns credit to each channel?
  • How do you handle channels where we have impression data but no click data?
  • Can finance review the methodology directly, or are they expected to trust the output?
  • What does the onboarding process look like, and how long before we have outputs we can act on?

Where Fospha fits

Fospha's daily, impression-led MMM is built specifically to resolve the structural bias of last-click measurement. Its glass-box transparency means finance can see and interrogate how channel credit is assigned - which is what turns a measurement output into an agreed operating view rather than another number to debate. For brands selling on Amazon or TikTok Shop alongside DTC, Fospha's Total Commerce Integration ensures the measurement covers the full business from day one, not only the DTC portion.

Brands primarily DTC with a simpler channel mix and a need to build internal buy-in before a larger commitment may find it useful to start with a lighter-weight MMM platform and use that as a proof of concept before moving to a more comprehensive operating system.

Stage 2: You have MMM but it arrives quarterly and cannot drive daily decisions

What is typically happening at this stage

You have invested in measurement. The numbers are more trustworthy than last-click. Marketing and finance are broadly aligned on what is working. The problem is that the insight cycle is too slow for the media environment you are operating in.

Your MMM arrives quarterly. By the time it does, it is describing a media landscape from three months ago - before the algorithm shift, before the creative cycle turned, before your biggest competitor changed their spend strategy. You are making this week's decisions with last quarter's model.

Teams at this stage often develop workarounds: they use GA4 data for fast decisions and the MMM for strategic review. This creates a two-speed measurement system where the fast data has structural biases and the accurate data is too old to act on. Neither source alone is adequate.

What you need at this stage

Daily measurement that refreshes daily and operates at the ad level. The specific requirement is that a signal about creative fatigue, channel saturation, or incremental headroom needs to arrive in time to act on it - not in a quarterly report that arrives after the opportunity has passed.

The secondary requirement is a platform that connects those signals directly to execution. Even daily insights have limited value if they require a manual cycle of export, analysis, recommendation, approval, and campaign change before they reach the media buying system. The closer the loop between measurement signal and executed change, the more value the measurement generates.

Capabilities to evaluate

  • Update cadence. How frequently does the model update? Daily is the meaningful threshold for operational use. Weekly models are an improvement on quarterly but still lag behind the pace of modern paid media.
  • Granularity. Does the model produce outputs at the ad level, or only at the channel or campaign level? Ad-level granularity is required for creative optimization and for feeding automated bidding systems.
  • Forward-looking outputs. Does the platform provide forecasting - saturation curves, headroom estimates, scenario planning? Or does it only describe historical performance? The most actionable measurement tells you where to invest next, not only what happened last.
  • Automation integration. Can the platform's outputs connect directly to budget automation tools like Smartly, without requiring a manual export step? This is the capability that converts measurement from a reporting function into an execution driver.

Questions to ask vendors at this stage

  • How frequently does the model update, and what is the lag between media activity and model output?
  • At what level of granularity are outputs available - channel, campaign, ad set, creative?
  • Do you provide forward-looking forecasting, and how are saturation and headroom signals generated?
  • Can your outputs feed directly into automated budget tools? Which integrations exist today?
  • How does the model handle the pace of change in fast-moving channels like TikTok?

Where Fospha fits

Fospha's daily MMM updates daily at the ad level - a meaningful technical advance on traditional quarterly modeling. Its causal forecasting layer provides saturation curves and headroom estimates that refresh continuously, so teams can see not only what worked last week but where incremental spend is likely to generate most return this week. Its integration with Smartly closes the loop between signal and execution: Gymshark's 39% higher observed ROAS on TikTok during peak periods came from connecting Fospha's daily measurement signals directly to Smartly's automated budget allocation, without a manual intervention cycle.

Stage 3: You sell across multiple commerce destinations and cannot see the full picture

What is typically happening at this stage

A meaningful share of your revenue comes from Amazon, TikTok Shop, or both. But your measurement stack was built for DTC. It measures what happens on your website and largely ignores what happens elsewhere.

The operational consequence is that you are making channel investment decisions based on partial information. You cannot see how your Meta spend influences Amazon revenue. You cannot measure the halo effect of TikTok awareness on purchases that happen through TikTok Shop's native checkout. You are optimizing your DTC performance while remaining blind to the downstream effects of those decisions on your marketplace revenue.

For many brands, this gap is larger than it appears. Customers who see a brand on TikTok often convert on Amazon - where they have Prime, where the checkout is frictionless, where they already have stored payment details. If your measurement treats that Amazon conversion as organic, you are systematically under-crediting the paid media that drove it.

What you need at this stage

Total commerce measurement. A platform that ingests and models performance across every sales destination - DTC, Amazon, TikTok Shop, and emerging marketplaces - and delivers a unified view of how media investment drives revenue across the full business.

The specific metric that matters here is Total Commerce ROAS: a single ROAS figure that reflects all revenue generated by your media investment, not only the revenue that converts on your own site. Without this, channel investment decisions are structurally incomplete.

Capabilities to evaluate

  • Marketplace data ingestion. Does the platform natively ingest Amazon and TikTok Shop sales data? Not as a manual upload or a periodic export, but as a continuous, modeled data stream.
  • Cross-channel halo effect modeling. Can the platform quantify how paid media on one platform drives sales on another? This is the core capability that makes total commerce measurement meaningful rather than just a data aggregation exercise.
  • Total Commerce ROAS. Does the platform produce a single ROAS metric that reflects all revenue - DTC and marketplace - attributed to your media investment? This is the number that allows apples-to-apples comparison across channels and campaigns.
  • GMV Max support. For brands running TikTok Shop, does the platform support GMV Max campaigns specifically? This is an important consideration as TikTok's commerce advertising formats continue to evolve.

Questions to ask vendors at this stage

  • Does your platform ingest Amazon and TikTok Shop sales data natively and continuously?
  • Can you show me how a Meta campaign's influence on Amazon revenue appears in your model?
  • What is your methodology for attributing halo effects across sales destinations?
  • Do you support GMV Max campaigns on TikTok Shop?
  • What does Total Commerce ROAS include, and what does it exclude?

Where Fospha fits

Total Commerce Integration is a core capability of Fospha's platform - not a roadmap item. It ingests and models performance across owned sites, Amazon, TikTok Shop (including GMV Max), and emerging marketplaces, producing a Total Commerce ROAS metric that reflects where customers actually buy. The halo effect measurement that allowed Necessaire to drive 47% higher Prime Day revenue than industry benchmarks came from sustained top-of-funnel investment that Fospha's cross-channel halo data made visible and justifiable. Give Me Cosmetics scaled TikTok Shop spend 73% using the same total commerce visibility, driving +29% blended daily revenue in a single quarter.

Among the tools currently available, Fospha offers the most developed approach to total commerce measurement at daily granularity.

Stage 4: You need measurement that drives automated outcomes, not only informed decisions

What is typically happening at this stage

Your measurement is reasonably good. The numbers are trusted. The team understands what they mean. The problem is velocity. The cycle from insight to action is too slow for the media environment you are competing in.

A typical manual optimization cycle looks something like this: an analyst runs the weekly report, identifies that TikTok has headroom and Meta is approaching saturation, builds a recommendation deck, presents it to the media team, gets approval, updates campaign budgets, and waits to see the effect. That cycle takes days. In a media environment where algorithms shift overnight and creative fatigue can set in within 72 hours of a launch, days is too long.

The brands outperforming their peers at this stage are typically those that have closed the loop between measurement and execution - where model signals flow directly into automated budget systems without a human intervention cycle in between.

What you need at this stage

Measurement designed to feed automation. The specific requirement is that signals from the model - saturation alerts, headroom estimates, performance indices - connect directly to budget pacing systems and campaign management tools without requiring a manual handoff.

This is not the same as AI-generated recommendations that a human reviews and approves. It is measurement integrated into the execution layer, where a shift in the model's view of a channel's efficiency triggers an automatic adjustment in that channel's budget allocation.

Capabilities to evaluate

  • Native automation integrations. What budget automation platforms does the tool integrate with natively? Smartly, for example, is a common integration point for brands running Meta and TikTok at scale. The integration needs to be bidirectional and real-time, not a periodic export.
  • Signal quality for automation. Are the model's outputs stable enough to drive automated decisions without generating excessive volatility? Daily model updates need to produce signals that are directionally reliable, not noisy.
  • Guardrails and controls. What guardrails exist to prevent automated systems from making decisions that go outside agreed parameters? Share-of-wallet benchmarks, budget floor and ceiling constraints, and saturation thresholds are all worth understanding before connecting measurement to automated execution.
  • Transparency for oversight. Even when execution is automated, teams need visibility into why decisions were made. Can you see which model signals drove which automated actions?

Questions to ask vendors at this stage

  • Which automation platforms do you integrate with natively, and how does the integration work in practice?
  • How stable are your daily model outputs? What is the typical signal-to-noise ratio in daily budget recommendations?
  • What guardrails exist to constrain automated decisions within agreed parameters?
  • How do we maintain visibility and oversight into automated decisions?
  • Can you share an example of a brand that has connected your measurement to automated execution, with outcomes?

Where Fospha fits

Fospha's automation architecture is designed to close the gap between measurement signal and executed change. Its integration with Smartly is the most documented example: Gymshark's media team connected Fospha's daily measurement outputs directly to Smartly's budget automation, enabling continuous rebalancing toward higher-performing campaigns without a manual approval cycle. The result was 39% higher observed ROAS on TikTok during peak periods - driven not by a single large budget decision but by the compound effect of frequent, small, model-guided adjustments that a human team could not have made at the same velocity.

Fospha's use of share-of-wallet benchmarks from its network of hundreds of retail brands as guardrails in automated optimization means decisions are constrained by market context, not only by internal performance history.

A note on building a measurement stack, not just choosing a platform

One of the most common mistakes in measurement platform selection is treating it as a replacement decision rather than a stack decision. The question is rarely "which single tool should we use?" It is "which tools play which roles, and how do they work together?"

A well-designed measurement stack for a retail brand in 2026 typically has three layers:

  1. A strategic measurement layer - an daily MMM that provides the full-funnel, cross-channel view used for budget allocation, planning, and finance alignment. This is the layer that needs to be most trusted across the organization.
  2. A validation layer - incrementality tests or geo-based lift studies that provide causal validation for major budget decisions. These do not need to run continuously, but they need to run regularly enough to anchor the MMM outputs in externally verified evidence.
  3. An execution layer - attribution data and automated bidding systems that operate at the speed of the campaign. These are most useful for creative optimization, audience decisions, and real-time pacing - not for cross-channel strategy.

Fospha is designed to sit at the center of this stack - as the strategic measurement layer that makes the other layers more useful. Its daily MMM provides the daily context that makes incrementality tests easier to interpret. Its ad-level outputs provide the signal quality that makes automated execution more reliable. And its glass-box transparency means the strategic layer is trusted by finance and leadership, not only by the marketing team.

Summary: key questions for any measurement vendor

Regardless of which stage you are at, these questions will surface the most important differences between vendors:

  • How frequently does your model update, and at what level of granularity?
  • How do your outputs reconcile with actual business revenue?
  • What sales destinations do you ingest and model - DTC only, or marketplaces too?
  • Can your outputs feed directly into automated execution, and what integrations exist?
  • How do you handle channels where click data is limited or unavailable?
  • What does your methodology for cross-channel halo effects look like?
  • How do finance teams typically engage with your outputs?
  • Can you share examples of brands at a similar stage to us, with specific outcomes?

The answers to these questions will tell you more about fit than any features comparison or pricing conversation.

For a full breakdown of the leading privacy-safe measurement tools available in 2026, see the companion piece:  Top 7 Privacy-Safe Marketing Measurement Tools for Retail Brands in 2026

To see how Fospha works for your specific channel mix and commerce destinations, book a demo with the team.

Top 7 Privacy-Safe Marketing Measurement Tools for Retail Brands in 2026

Quick answer: Privacy-safe marketing measurement tools are platforms that quantify paid media performance without relying on third-party cookies, user-level tracking, or pixel-based identity resolution. In 2026, the leading tools use Media Mix Modeling (MMM), aggregated data science, and first-party signals to deliver channel attribution, budget forecasting, and cross-channel ROAS accurately and in compliance with modern privacy regulation. This guide covers the top 7 options for retail and ecommerce brands running significant paid media budgets.

The measurement conversation has finally caught up with reality.

For years, "attribution" meant a pixel on your website, a cookie in a browser, and a dashboard that told you which ad got the last click. It worked, until it didn't. iOS 14 reduced signal fidelity. GDPR tightened enforcement. Third-party cookies became increasingly unreliable. And the customer journey expanded beyond your website onto Amazon, TikTok Shop, and a dozen other surfaces that a pixel was never designed to see.

Brands that rely primarily on last-click attribution in 2026 risk making systematically skewed budget decisions, under-crediting upper-funnel channels that drive demand and over-weighting bottom-funnel channels that capture it. The result is a measurement stack that finance finds difficult to trust and leadership finds difficult to act on.

A new generation of privacy-safe measurement tools is purpose-built for this environment. They do not need cookies. They do not rely on fragile identity graphs. And the best of them go beyond describing what happened - they help you think clearly about where to put your next dollar.

Here is what to look for, and which tools are worth considering.

What makes measurement "privacy-safe" in 2026?

Privacy-safe measurement means your measurement methodology does not depend on tracking individual users across sessions, devices, or platforms. In practical terms, a tool earns the label if it meets these conditions:

  1. No third-party cookie dependency. The measurement works at meaningful fidelity without third-party cookies - not through a fallback mode, but by design.
  2. No user-level cross-site tracking. The platform does not stitch individual user journeys together across domains using fingerprinting, probabilistic matching, or identity resolution that relies on third-party data brokers.
  3. Compliant with GDPR, CCPA, and emerging privacy regulation by design. Not through legal workarounds, but because the methodology does not require the data those regulations restrict.
  4. Aggregated modeling, not individual attribution. The platform uses statistical methods - Media Mix Modeling, geo-based lift studies, aggregate first-party signals - rather than user-level path attribution as the primary measurement approach.

What privacy-safe measurement is not: a multi-touch attribution tool with a cookie consent banner added on top. If the underlying methodology still depends on clickstream data and individual-level conversion events, the "privacy-safe" label reflects positioning rather than technical reality.

Notable trends shaping measurement in 2026

MMM has moved from enterprise luxury to practical default. Five years ago, Media Mix Modeling required six-figure analytics budgets and a dedicated data science team. In 2026, modern MMM platforms have compressed time-to-value from months to weeks, brought pricing into accessible SaaS ranges, and shifted outputs from quarterly strategy decks to daily, ad-level insights. Most serious measurement vendors now have MMM at their core or are building toward it.

Total commerce measurement has become essential for omnichannel brands. The brands most exposed by measurement gaps in 2026 are those selling on Amazon and TikTok Shop alongside their own site. Pixel-based tools were not designed to measure what happens on those platforms. The emerging standard is Total Commerce ROAS - a single metric that attempts to reflect performance across every surface where customers buy, not only where they land after clicking an ad.

Finance alignment has become a strategic priority. The CMOs winning internal budget conversations in 2026 tend to have measurement outputs that reconcile with revenue reality. When marketing and finance operate from different versions of performance data, the natural instinct is to cut what cannot be substantiated. The measurement tools gaining traction are those that produce outputs finance can interrogate, not only numbers marketing can defend.

Automation is reducing the gap between insight and action. Daily ad-level measurement has a natural downstream destination: feeding automated bidding systems. The tools pulling ahead are those designed to close the loop between measurement insight and execution - where a signal about saturation or headroom connects directly to a campaign adjustment without requiring a manual export-and-approval cycle.

AI-native measurement is emerging. The next frontier is measurement that is natively queryable by AI agents - platforms with MCP integrations that allow measurement data to flow directly into tools like Claude or ChatGPT. This is early-stage, but directionally significant: measurement that lives inside the AI workflows where decisions happen.

The 7 best privacy-safe marketing measurement tools for retail brands in 2026

1. Fospha: Best for unified full-funnel measurement across DTC and marketplaces

Quick answer: Fospha is a daily, impression-led Measurement Operating System for retail commerce brands. Its Media Mix Model updates daily at the ad level and unifies performance across DTC, Amazon, TikTok Shop, and other marketplaces. It is designed for brands running $1M or more in annual paid media who need measurement that marketing, finance, and leadership can act on together.

What it does

Fospha is the Measurement Operating System for retail commerce brands running paid media across DTC, Amazon, TikTok Shop, and beyond. Its impression-led Media Mix Model delivers daily, ad-level measurement that unifies performance across channels and sales destinations - making it one of the few platforms that quantifies how paid media spend influences revenue on Amazon and TikTok Shop as well as your own site.

Most attribution tools answer "which ad got the click?" Fospha is designed to answer a different question: what is every channel, every impression, every view, every ad contributing to revenue across the full business, everywhere customers buy?

Why it leads in 2026

Most ecommerce attribution tools stop at your homepage. Fospha's Total Commerce Integration ingests and models performance across owned sites, Amazon, TikTok Shop (including GMV Max), and emerging marketplaces, delivering a Total Commerce ROAS metric that reflects where customers buy, not only where they click. For brands running omnichannel commerce, that distinction is the difference between measuring part of the business and measuring all of it.

The core differentiator is glass-box science. Rather than delivering recommendations that cannot be interrogated, Fospha surfaces the workings of its model at every stage - from visit and transaction modeling to impression attribution and cross-channel halo effects. Finance teams can see how the numbers were produced. Marketing teams can explain them in budget meetings. That transparency is what turns measurement outputs into decisions.

Fospha is also built to make other measurement approaches more useful, not to replace them. Its daily MMM complements incrementality tests by providing continuous daily context between experiments, and reinforces attribution data by situating it within a full-funnel view. Marketers do not have to choose between methodologies - Fospha is designed to sit at the center of the stack and make each layer more actionable.

Key strengths

  • Daily MMM updated daily at the ad level, combining the strategic scope of periodic modeling with the operational cadence of attribution
  • Cross-channel halo effect visibility: quantifies how upper-funnel spend on one platform influences sales on another (Amazon, DTC, organic search)
  • Forward-looking forecasting with saturation curves, providing a data-grounded view of where incremental spend is likely to generate most return
  • Automated budget optimization via integrations with platforms like Smartly, connecting insight to execution
  • Market intelligence benchmarks drawn from hundreds of retail brands, providing context for whether your ROAS reflects genuine outperformance or only looks strong relative to your own history
  • AI-ready by design: Fospha's MCP server makes measurement data directly queryable by external AI agents, including integrations with Claude and ChatGPT, so measurement flows into the systems where decisions are made

Proof it works

Best for: DTC and omnichannel brands running $1M or more in annual paid media across Meta, TikTok, YouTube, Google, Amazon, and TikTok Shop who need measurement that marketing, finance, and leadership can trust and act on daily.

Limitations: Fospha is purpose-built for retail commerce. It is not designed for B2B, subscription-only businesses, or brands without significant paid media investment. Brands that are purely DTC with no marketplace presence will use a smaller portion of the platform's capabilities, though the daily MMM and market benchmarks still represent a meaningful step forward from last-click attribution.

2. Recast: Best for validated MMM with integrated lift test calibration

What it does

Recast is an incrementality measurement platform that combines a proprietary Bayesian MMM with universal lift test calibration and a full suite of forecasting and planning tools. It uses a fully probabilistic modeling approach, providing uncertainty ranges around every estimate rather than single-point outputs, and delivers refreshed model outputs on a regular cadence.

Key strengths

  • Bayesian methodology provides calibrated uncertainty estimates rather than false precision
  • Universal lift test calibration integrates experimental evidence directly into the MMM
  • Weekly forecast accuracy reporting holds the model accountable to real-world outcomes
  • Strong thought leadership around MMM methodology, published openly
  • Operates without pixel or cookie data, genuinely privacy-native by design

How it fits alongside Fospha

Recast delivers channel-level and campaign-level outputs but does not currently operate at daily ad-level granularity. It is oriented toward strategic planning rather than daily operational decisions or automated budget execution, and does not offer total commerce measurement across Amazon or TikTok Shop. Brands that need daily execution cadence and unified DTC-plus-marketplace measurement will typically find Fospha more suited to those requirements. Recast and Fospha can serve complementary purposes - Recast's probabilistic rigor and lift test calibration can provide useful validation context alongside Fospha's daily operational layer.

Best for: Complex, high-spend brands - including Fortune 500, CPG, fintech, and pharmaceutical - that need rigorous, validated MMM they can trust for operational budget decisions.

3. Mutinex: Best for enterprise brands that need campaign-level MMM with AI-driven analysis

What it does

Mutinex is an MMM platform built for enterprise marketing teams. It operates a three-product suite: DataOS (data ingestion and structuring for MMM), GrowthOS (their core MMM platform with campaign-level insights, scenario planning, and real-time optimization), and MAITE (an AI consultant layer trained on the brand's own MMM model for instant analysis and recommendations).

Key strengths

  • Patent-pending Campaign-Varying MMM that models performance at the campaign, creative, format, publisher, geography, and audience level - not only the channel level
  • Three-product suite covering data ingestion, MMM, and AI-driven analysis in a single platform
  • Self-Serve GrowthOS delivers a production-grade model in under 24 hours with no consultants or data engineers required
  • MAITE AI layer provides instant analysis and recommendations trained on the brand's own model
  • Strong footprint in APAC markets alongside growing global enterprise presence
  • Focus on connecting measurement to commercial planning, not only reporting

How it fits alongside Fospha

Mutinex is primarily positioned for enterprise brands across CPG, telco, QSR, and finance rather than DTC and marketplace ecommerce, which makes a direct like-for-like comparison on marketplace measurement less relevant. For brands running significant revenue through Amazon or TikTok Shop alongside DTC, Fospha's Total Commerce Integration provides a measurement scope specifically designed for that commerce model. The two platforms serve different primary customer segments and can sit alongside each other in organizations that operate across both enterprise and ecommerce channels.

Best for: Enterprise brands across CPG, QSR, telco, finance, and retail that need campaign-level MMM with AI-driven analysis and scenario planning, particularly those with APAC operations or a primarily omnichannel commerce model.

4. Analytic Partners: Best for enterprise brands needing deep commercial analytics at scale

What it does

Analytic Partners delivers Commercial Analytics through their GPS Enterprise (GPS-E) platform - a consulting-and-technology model that goes beyond MMM to connect marketing, sales, operations, finance, and pricing into a unified commercial intelligence layer. Their ROI Genome is a proprietary dataset built from decades of cross-client measurement data.

Key strengths

  • Decades of cross-client data supporting genuine competitive benchmarking through the ROI Genome
  • GPS Enterprise platform connects marketing, sales, operations, finance, and pricing in a single commercial intelligence layer
  • Strong multi-market and cross-country measurement capabilities
  • Deep consulting relationship model with senior-level strategic support
  • Covers both online and offline media channels including TV and out-of-home

How it fits alongside Fospha

Analytic Partners' model is built around a deep consulting relationship, with outputs oriented toward strategic planning cycles rather than daily budget execution - though their platform has been evolving to support faster decisioning. For brands that need daily budget adjustments or need to feed measurement signals into automated bidding at the campaign level, Fospha is designed specifically for that operational cadence. For organizations that need both strategic depth and operational speed, the two can serve different planning horizons within the same measurement program.

Best for: Large enterprise brands with $50M or more in media budgets across multiple markets and channels, particularly those with significant offline media investment where consulting-grade commercial analytics justify the engagement model.

5. Google Meridian: Best for data science teams wanting an open-source MMM foundation

What it does

Google Meridian is an open-source MMM framework designed to give advertisers a transparent, auditable methodology for measuring marketing effectiveness. It is publicly documented and intended to be deployed by brands' own data science teams or through implementation partners.

Key strengths

  • Fully open-source and independently auditable methodology
  • No licensing cost for the framework itself (implementation and ongoing maintenance cost applies)
  • Integration with Google's advertising ecosystem and data products
  • Methodology can be interrogated and validated by technical teams
  • Meridian GeoX (announced, coming soon): geo-based incrementality calibration that integrates MMM with geo lift experiments directly within the Meridian framework

How it fits alongside Fospha

Meridian is a framework rather than a managed product. Deploying it requires meaningful internal data science resource, ongoing maintenance, and the expertise to translate model outputs into operational decisions - a significant capability requirement for most retail marketing teams. It is worth noting that Meridian is built and maintained by the world's largest digital advertising platform, which is a factor worth considering when evaluating objectivity in measuring Google channels alongside alternatives. It does not currently address total commerce measurement; Amazon and TikTok Shop performance sits outside its scope. Google has also announced Meridian GeoX, a forthcoming geo-based incrementality calibration module that will extend Meridian's capabilities beyond pure MMM into experiment-driven model calibration. Fospha is a managed, daily platform that does not require in-house data science to operate and extends measurement across the full commerce landscape.

Best for: Brands with in-house data science teams, strong technical infrastructure, and primarily Google-centric media mixes who want a transparent, auditable MMM foundation and have the capability to own and maintain it internally.

6. Lifesight: Best for brands wanting unified causal measurement with AI-driven budget execution

What it does

Lifesight is a Marketing Decision Intelligence platform that combines Causal MMM, geo-based incrementality testing, and calibrated attribution into a unified causal measurement engine - with an AI agent layer (MIA - Marketing Intelligence Agents) that automates budget optimization, experiment design, anomaly detection, and CFO reporting. The platform is designed to deliver answers grounded in causation rather than correlation, with AI agents that act on measurement data in real time.

Key strengths

  • Unified causal measurement engine combining Causal MMM, geo-based incrementality testing, and calibrated attribution
  • MIA (Marketing Intelligence Agents): AI agents for budget optimization, scenario planning, experiment design, anomaly detection, and CFO reporting - within user-defined guardrails
  • 1-click budget reallocation pushing directly to Google, Meta, Amazon, and TikTok based on incremental ROAS, not platform-reported ROAS
  • 50+ native integrations including Google, Meta, Amazon, TikTok, Shopify, The Trade Desk, and CTV
  • Privacy-first architecture that does not depend on third-party cookies or cross-site tracking

How it fits alongside Fospha

Lifesight's unified causal approach -combining MMM, incrementality testing, and attribution in a single engine - is a genuinely different architectural choice from Fospha's daily MMM-led model. Where the two differ most meaningfully is in total commerce measurement across DTC and marketplace destinations: Fospha's Total Commerce Integration, cross-channel halo effect modeling, and Total Commerce ROAS across Amazon and TikTok Shop are specifically built for omnichannel retail brands selling across multiple surfaces. For brands where the primary measurement need is causal attribution with AI-driven execution, Lifesight is a strong option; for brands where total commerce visibility across marketplaces is the priority, Fospha's scope is more directly suited.

Best for: DTC, ecommerce, retail, and CPG brands that want a unified causal measurement platform combining MMM, incrementality testing, and attribution - with AI agents that automate budget optimization and push changes directly to ad platforms.

7. LiftLab: Best for brands that need brand and performance measured in the same model

What it does

LiftLab is a unified marketing measurement platform built around Agile Marketing Mix Modeling (AMM), combining a proprietary Two-Stage MMM with an incrementality testing suite and a scenario planner - designed to turn every dollar of brand and performance spend into compounding economic value.

Key strengths

  • Agile Marketing Mix Modeling (AMM): a Two-Stage MMM that separates ad auction dynamics from consumer response to build accurate diminishing returns curves
  • Brand and performance spend measured in the same model over a 6 to 52 week horizon
  • Incrementality Testing Suite using transparent geo experiments, with results fed back into the AMM through the Trust Engine to permanently sharpen response curves
  • Scenario planner for forward-looking budget allocation decisions
  • Auditable methodology designed for finance and leadership audiences

How it fits alongside Fospha

LiftLab's Agile MMM covers brand and performance spend in the same model and delivers accurate diminishing returns curves across longer planning horizons. Where it differs from Fospha is in daily ad-level granularity and total commerce measurement across DTC and marketplace destinations. The forward-looking forecasting at the daily ad level and market intelligence benchmarking across hundreds of retail brands that Fospha provides are not part of LiftLab's core offering. The two tools address different layers of the measurement stack and can reinforce each other - Fospha's daily measurement providing operational context alongside LiftLab's longer-horizon AMM and incrementality validation.

Best for: Growth-focused brands that need a unified, auditable MMM platform where brand and performance investment are measured in the same model, with integrated incrementality testing that continuously improves forecast accuracy - particularly suited to brands with complex full-funnel media mixes.

Frequently asked questions

What is the difference between privacy-safe measurement and traditional attribution?

Traditional attribution (last-click, multi-touch) tracks individual users across sessions and devices using cookies and pixels. Privacy-safe measurement uses aggregated statistical methods - primarily Media Mix Modeling - that do not require identifying or tracking individual users. It measures marketing effectiveness at the aggregate level, designed to work within GDPR, CCPA, and an environment where third-party cookies are increasingly unavailable.

Is Media Mix Modeling accurate enough for daily decisions?

Modern, daily MMM platforms like Fospha update daily and operate at the ad level - a meaningful technical advance on traditional quarterly MMM. The accuracy is generally sufficient for budget allocation and channel mix decisions when combined with the transparency that allows teams to interrogate the model's assumptions. Daily MMM is not designed to replace granular click-level data for creative testing and micro-optimization; both have a role in a well-structured measurement stack.

Do I need to stop using GA4 or my attribution tool?

No. GA4 and last-click attribution tools provide fast, useful signals for micro-optimization - which creatives are performing, which audiences are converting. The challenge arises when they become the primary source of truth for strategic budget allocation across channels. A well-designed measurement stack typically uses MMM for channel mix and budget decisions, and attribution tools for fast creative and audience iteration. Fospha is designed to sit alongside these tools and make the full stack more coherent.

Do these tools work for brands selling across DTC and marketplaces?

Most tools in this list were designed primarily for DTC or enterprise measurement. Fospha is the tool in this list most explicitly built for total commerce - ingesting and modeling performance across owned sites, Amazon, TikTok Shop (including GMV Max), and emerging marketplaces. Brands running significant revenue through marketplaces alongside DTC should evaluate how each tool handles that scope before committing.

What data does a privacy-safe MMM platform typically need?

Typically: aggregated media spend and impression data by channel and campaign, sales or revenue data by day, and context variables such as seasonality, promotions, and pricing changes. For total commerce platforms like Fospha, you also connect Amazon and TikTok Shop data. No user-level data, individual conversion events, or personally identifiable information is required.

How do I get finance to trust measurement outputs?

Choose a platform with transparent methodology - one where finance can see how credit is assigned and interrogate the model's assumptions. The measurement tools gaining internal traction in 2026 are those that produce a single, reconciled view of performance that marketing and finance can both operate from, rather than outputs that one function has to take on faith.

Ready to see what unified, full-funnel measurement looks like in practice? The companion piece to this guide - How to choose a marketing measurement platform: a practical guide for retail CMOs - walks through the decision by maturity stage, with specific questions to ask any vendor before you commit.

Or if you are ready to see how Fospha works for your channel mix and commerce destinations, book a demo with the team.

How do you set-up your measurement for automation?

The short answer

Automation tools - whether AI bidding systems, budget allocation platforms, or AI agents - are only as good as the measurement data feeding them. Setting up measurement for automation means four things: moving away from user-tracking approaches that privacy changes have made unreliable; building on causal methodology so the signal driving automated decisions is grounded in causal evidence, not just correlation; aligning marketing and finance around shared KPIs that both teams can act on; and choosing modeling infrastructure that updates fast enough to inform decisions daily. Get the foundation wrong and automation amplifies bad data. Get it right and the system compounds every incremental improvement.

AI-driven budget automation is becoming standard practice for retail eCommerce brands at scale. Platforms like Google's Performance Max and Meta's Advantage+ make automated bidding decisions thousands of times a day. More sophisticated teams are feeding measurement data directly into AI agents and budget allocation tools to automate channel-level spend decisions on top of that.

The automation layer is increasingly capable. The question is what it's running on.

Most measurement stacks were built for a different era - one where pixels and cookies could track individual user journeys reliably, and attribution models could assign credit to specific touchpoints with reasonable accuracy. That era ended with Apple's iOS 14.5 in 2021, when App Tracking Transparency (ATT) required users to opt in to conversion tracking. The vast majority opted out. The Identifier for Advertisers (IDFA), the primary data point for mobile attribution, became unreliable at scale overnight. Research consistently shows that a significant proportion of marketing activity goes unmeasured by click-based attribution - in some estimates, the majority of upper-funnel, awareness-building activity - as opt-out rates have made individual journey tracking unreliable at scale.

Automation trained on that signal tends to reinforce whatever biases the measurement already has, at scale and at speed.

Why does privacy change matter for automation specifically?

Customer-journey based measurement - including last-click attribution, Multi-Touch Attribution (MTA), and Data-Driven Attribution (DDA) - works by tracking individual users across touchpoints and assigning credit based on observed paths to conversion. When those paths become harder to observe due to opt-outs and cookie deprecation, the models tend to overweight the touchpoints they can still see: bottom-of-funnel, demand-capture channels like search and retargeting.

When automation runs on that signal alone, it makes the same mistake. Budget concentrates on demand capture. Upper-funnel investment drops. The demand pool shrinks. Performance appears stable in the short term and deteriorates over time.

The problem isn't the automation. It's the measurement underneath it.

What does measurement built for automation require?

Does your measurement use privacy-robust methodology?

The first shift is methodological: away from user-level tracking and toward aggregated, privacy-first approaches. Media Mix Modeling (MMM) is the primary alternative - it uses statistical analysis of historical data to identify relationships between marketing investment and business outcomes, without tracking individual users. Because it works with aggregated data, it is structurally less exposed to ATT, cookie deprecation, and the privacy changes that continue to erode the reliability of identity-based tracking.

For automation, this matters because it means the signal feeding automated decisions won't degrade as privacy controls tighten further. A measurement approach built on pixel tracking will become less reliable as privacy controls tighten. An MMM-based approach is structurally better positioned to remain stable because it doesn't depend on the signals being deprecated.

Is your measurement causal, or just correlational?

MMMs show that marketing activity and sales move together. Traditional MMMs can't prove that one caused the other - they're correlational. That distinction matters enormously for automation, because a correlational signal will confidently recommend reallocating budget toward channels that happen to correlate with strong periods, even if those channels aren't driving the outcome.

Incrementality testing provides the causal layer: controlled experiments that isolate the incremental impact of a specific channel or campaign by comparing outcomes between an exposed group and a held-out control. When designed well, incrementality tests provide the strongest available causal evidence in marketing measurement - isolating the true incremental impact of a channel rather than inferring it from correlational patterns.

The most robust measurement infrastructure combines both: an advanced MMM that is continuously calibrated by incrementality test results, so causal learnings from individual tests compound into the model's ongoing estimates. When that combined signal feeds automation, decisions are grounded in what drives growth.

Are marketing and finance aligned on the same KPIs?

Measurement built for automation has to work across the organization, not just within the media team. Finance teams increasingly demand causal evidence before approving budget decisions, and traditional metrics like ROAS and CPA don't provide it - they measure performance in isolation or retrospectively, without proving that marketing activity caused the observed outcomes.

Two KPIs are emerging as the shared language between marketing and finance: Incremental Profit - the true additional profit generated solely by a specific marketing activity after accounting for all associated costs - and Growth Headroom - the maximum capacity for profitable spending in a channel before hitting diminishing returns. Both are grounded in causal measurement, both are meaningful to CFOs and CMOs, and both give automation a target that actually reflects business value rather than platform-level efficiency metrics.

When marketing and finance are working from the same causal KPIs, automated budget decisions can be approved and defended at the board level, not just optimized within the media team.

Does your measurement update fast enough to inform daily decisions?

Traditional MMMs are slow. Quarterly or monthly reporting cycles were designed for annual budget planning, not for informing the daily and weekly spend decisions that automation operates at. An AI bidding system making thousands of decisions per day cannot wait three months for an updated model read.

The infrastructure shift that makes automation viable is the move to Daily MMM - a modeling approach that ingests new data continuously and retrains the model daily. This modeling allows prior knowledge (from earlier periods, incrementality tests, or calibration inputs) to be updated as new data arrives, producing estimates that are both statistically rigorous and current. Automated data ingestion removes the manual bottleneck that made traditional MMMs slow.

The result is measurement that operates at the speed automation requires: ad-level signal, updated every 24 hours, structured so it can flow directly into the tools and systems where spending decisions are made.

The four things to get right

Grounding the above in a practical framework, measurement ready for automation requires getting four things in place:

  1. Data strategy: Shift away from user-tracking solutions - pixels, third-party cookies, IDFA - that face ongoing regulatory risk and declining reliability. Build on aggregated, privacy-first models like MMM as the foundation.
  2. Methodological rigor: Make incrementality testing foundational, not occasional. Use tests not just as audits but as the calibration input that keeps the MMM's causal estimates accurate over time.
  3. Organizational alignment: Adopt shared KPIs grounded in causal incrementality metrics - Incremental Profit and Growth Headroom - so every budget conversation with finance is speaking the same language and automation targets are defensible at the board level.
  4. Technological agility: Choose modeling infrastructure that uses Bayesian methods for continuous calibration, updates daily, and is structured so measurement data flows into the execution platforms and AI systems where decisions are actually made.

Measurement as the foundation for automated growth

Automation doesn't create a measurement strategy - it inherits one. The brands that will get the most from AI-driven budget tools are the ones that have already built measurement infrastructure that is privacy-robust, causally grounded, organizationally aligned, and fast enough to keep up.

For brands building this foundation, the key capabilities to look for in a measurement infrastructure are: daily model retraining, full-funnel channel coverage, incrementality integration, and open APIs into execution platforms.

Fospha's Core, its always-on Daily MMM, is built around exactly these requirements. It ingests click and impression signals across every channel, reconciles them to eCommerce sources of truth, retrains daily, and makes measurement data available through open APIs and integrations with execution platforms. Incrementality test results feed back into the model, sharpening causal estimates over time. The output is measurement structured to flow directly into automated systems , not a report someone reads and then manually translates into decisions.

Using Ad Platform ROAS as the benchmark, the same metric available to all brands regardless of measurement approach, Fospha clients achieved on average 30% higher returns in 2024, benchmarked against Varos data covering thousands of eCommerce brands spending more than $100k per month across Meta, TikTok, and Google. That gap reflects not just better data, but what happens when better data is acted on, automatically, every day.

Common questions

Q: Can I run automation with my existing attribution stack while I build toward MMM?

Yes, but with clear-eyed expectations. Last-click and MTA-based attribution can still inform tactical, lower-funnel automation - search bidding, retargeting optimization - where the click signal is reasonably reliable. The risk is in using that same signal for channel-level budget allocation decisions, where bottom-funnel bias will systematically undervalue upper-funnel investment. Running both in parallel while transitioning is workable; treating click-based attribution as a substitute for causal measurement when feeding strategic automation is where brands run into trouble.

Q: What data does a Daily MMM actually need to run?

At the core: spend data by channel and campaign, and conversion or revenue data from an eCommerce source of truth such as Shopify or Magento. Impression and engagement data from upper-funnel channels improves the model's ability to estimate awareness contribution. Incrementality test results, when available, are ingested as calibration inputs. The model does not require user-level tracking data - it works with aggregated signals, which is precisely what makes it privacy-robust.

Q: How do you know when your measurement is ready to feed automation?

Three signals: the model updates at the same cadence as your automation decisions (daily for most paid media); it covers the full channel mix including upper-funnel channels, not just bottom-of-funnel; and the outputs are trusted by both marketing and finance, not just the media team. If your measurement is producing numbers that finance won't stand behind, automating against those numbers accelerates the problem rather than solving it.

Q: Does switching to causal measurement mean rebuilding everything from scratch?

Not necessarily. For brands with existing enterprise MMM infrastructure, a daily online measurement layer can sit alongside the existing stack rather than replacing it. The enterprise MMM handles offline, TV, and long-cycle planning questions. The Daily MMM handles daily online channel performance and feeds automation. The two answer different questions and where clients share their enterprise MMM outputs, Fospha can use those signals as calibration inputs, keeping both models coherent without merging them. Brands gain speed without losing the strategic rigour already in place.

Related reading

See how Fospha works in practice. 30-minute walkthrough on your data, your channels, this quarter.

Book a demo

5 questions to ask your incrementality test provider before launching

The short answer

Incrementality testing is one of the most direct ways to validate cause and effect in marketing but a large share of tests fail not because of the math, but because of weak design, executional drift, or results that can't be acted on. Before launching a test, ask your provider how they control for contamination, what quality checks govern execution, whether the hypothesis and success metric are precisely defined, how results feed into ongoing decisions, and whether lag effects and cross-channel halo are accounted for. The answers tell you whether you'll get causal insight or just an expensive snapshot.

Incrementality testing has become a standard tool for scaled retail eCommerce brands that want causal validation - the strongest available evidence that a channel or campaign is actually driving growth, not just correlating with it. The methodology is sound. The problem is that a significant share of test failures happen before the first impression is served: in the design, the execution, or the way results are interpreted and used.

These five questions are the ones worth asking any provider before you commit time and budget.

1. How do you prevent contamination and external factors from biasing results?

Geo-based holdout tests are powerful, but they sit in the real world. People commute between regions. Platforms don't always respect geographic boundaries. Local events - a competitor promotion, a stockout, a regional news cycle - can shift performance in ways that have nothing to do with your test.

A provider worth working with will document how they handle this, not just assert that their methodology is robust.

What good looks like: Test and control geographies are selected with spillover in mind - ideally using mobility-aware groupings that account for commuting patterns and cross-region exposure. There's a pre-period fit analysis showing that test and control regions behaved similarly before the test launched. Local shocks are monitored throughout the run, with pre-defined rules for exclusion or adjustment if something material happens. Contamination diagnostics are shared as part of the results, not buried.

Red flags: Generic geo lists with no evidence of spillover checks. No record of concurrent campaigns or local disruptions. No documentation of how the control group was validated. If these controls aren't in place, treat reported lift as directional rather than definitive.

2. What are your quality-control processes for execution?

Executional drift is one of the most common reasons test results can't be trusted. Incorrect dates, missing audience suppressions, overlapping tests in the same region, parameters changed mid-run without logging - any of these can compromise validity before the analysis even begins.

What good looks like: A pre-flight checklist reviewed and signed off before launch, covering audience definitions, spend caps, exclusions, and start dates. A timestamped runbook that logs every campaign change, creative swap, outage, and promotion during the test window. Account- or campaign-level exclusions to prevent platform bleed, verified against delivery data. Agreed thresholds for health checks and interim reviews, including criteria for extending or re-running the test if core assumptions break.

Red flags: No written setup documentation. Overlapping tests within the same region or audience. Mid-test parameter changes with no change log. Without operational discipline, even strong analytical frameworks can't recover validity after the fact.

3. Is the hypothesis single and specific, and does the success metric match it?

Every robust test starts with one causal hypothesis and one primary success metric. When those aren't locked in before launch, results can look statistically significant while offering nothing actionable.

What good looks like: A single primary hypothesis stated precisely - for example, "increasing prospecting spend in the US will lift new-customer acquisition" - with one primary metric (incremental new-customer lift) and secondary metrics for context (branded search, assisted conversions). For awareness tests, the primary metric should reflect the funnel stage being tested: brand-lift or awareness delta, not iROAS. Power analysis, duration planning, and stop rules are defined upfront, not adjusted after the data comes in.

Red flags: Undefined or shifting hypotheses. iROAS used as the sole KPI for upper-funnel campaigns. No evidence of power or duration planning. When the hypothesis and metric don't match the funnel stage being tested, the resulting lift number describes something real, but not what the test was designed to measure.

4. How do results feed into ongoing decisions, not just a one-time report?

Incrementality tests are snapshots. They show how marketing performed under specific conditions during a specific window. That's genuinely useful - but only if the learning carries forward. A lift report delivered at the end of a test and never integrated into planning is an expensive way to answer a question once.

What good looks like: Test results calibrate an always-on measurement model, so learnings remain relevant beyond the experiment window rather than aging immediately. The provider can show how lift results translate into concrete budget and channel decisions, connecting the test directly to day-to-day optimization. Results are layered with other sources - MMM trends, platform attribution - so marketing and finance share a single view rather than arguing from separate data sets.

Red flags: The engagement ends at "here's your lift report." No plan for integrating learnings into always-on systems. Tests running in isolation with no connection to the broader measurement mix. A good test explains what worked; a good system makes sure that explanation actually changes what happens next.

5. How do you account for lag effects and cross-channel halo?

Campaign impact rarely stops at the edge of a test window or a single channel. A Meta campaign may influence branded search or Amazon sales weeks after the test concludes. A YouTube burst can drive consideration that converts elsewhere, through a different channel, at a different time. If those effects aren't captured, the test can materially under- or over-estimate true incremental value.

What good looks like: Sufficient read windows to capture delayed conversions, or decay models that adjust for adstock - how the effect of spend carries over and fades across time. Correlated movement across search, direct, and marketplace channels is measured where feasible, with controls to avoid double-counting. For awareness campaigns, brand-lift or sentiment data is connected to downstream sales signals to show the full-funnel arc.

Red flags: Declaring results after very short windows. No mention of adstock or lag assumptions. Ignoring branded search or marketplace spillover entirely. When lag and halo go unaccounted for, test results describe a fragment of the impact rather than the whole.

How Fospha thinks about incrementality

Fospha is not an incrementality test provider - it is the always-on measurement layer that makes test results more useful by integrating them into a continuously updating model. Incrementality testing and always-on measurement answer different questions. Tests provide causal validation - a rigorous, point-in-time read of whether a channel drove incremental outcomes. Always-on Daily MMM provides continuous, daily signal across the full channel mix. Both matter, and they are most powerful when they work together.

Fospha's approach is to treat incrementality tests as calibration inputs, not isolated reports. When test results are available, they feed directly into the model - sharpening estimates of lag and halo effects and improving the accuracy of daily forecasts. The result is that causal learnings from a single test don't sit in a slide deck: they compound into a continuously improving view of what is driving growth.

That's the difference between a test that validates and a system that learns.

Common questions

Q: How long should an incrementality test run?

Duration depends on the channel, the funnel stage being tested, and the conversion volume in your control group. Tests that end too early frequently lack statistical power and produce unreliable lift estimates. For lower-funnel direct-response tests, two to four weeks is a common minimum. For upper-funnel awareness tests where lag effects are significant, longer windows or post-period read extensions are often necessary. Your provider should produce a power analysis before launch that specifies the minimum detectable effect and the duration required to achieve it.

Q: Can you run multiple incrementality tests at the same time?

Yes, but with care. Overlapping tests in the same geography or against the same audience introduce contamination risk - if both tests are running in the same regions, results from each can be biased by the other. Providers should have clear protocols for isolating concurrent tests, including geographic separation and audience exclusions. If your provider can't explain how overlapping tests are managed, run them sequentially rather than simultaneously.

Q: What's the difference between a geo holdout test and a conversion lift study?

A geo holdout test withholds advertising from a defined geographic region and measures the difference in outcomes between the held-out region and regions where advertising ran normally. A conversion lift study, run natively within platforms like Meta, withholds ads from a randomly selected audience segment rather than a geography. Geo holdouts tend to be more conservative and harder to game, but require sufficient geographic variation. Platform-native lift studies are easier to run but rely on the platform's own infrastructure, which introduces some dependency on the platform's methodology and reporting.

Q: What makes an incrementality test result "trustworthy" enough to act on?

Statistical significance is necessary but not sufficient. A result worth acting on also has: a pre-registered hypothesis and metric that match the funnel stage being tested; documented contamination controls; a clean execution log with no undisclosed mid-test changes; and a read window long enough to capture lag effects. If any of these are missing, treat the result as a directional signal rather than a definitive finding, and build the gap into how confidently you apply it to budget decisions.

Related reading

See how Fospha works in practice. 30-minute walkthrough on your data, your channels, this quarter.

Book a demo

Click vs impression measurement: which should you trust?

The short answer

If your measurement can only see clicks, most of what your media actually does goes unmeasured. Click measurement tracks conversions that follow a user clicking on an ad, giving credit to the last action before purchase. Impression measurement uses statistical modeling to quantify the contribution of every ad exposure, including video views and upper-funnel paid social, regardless of whether a click followed. Clicks reveal demand capture; impressions reveal demand creation. For retail eCommerce brands managing a multi-channel mix, relying solely on click data systematically undercredits the channels that generate awareness and drive future conversions, leading to under-investment in the media that builds long-term growth. Most marketing measurement is built around the click. A user sees an ad, clicks it, converts - the click gets the credit. Fast, deterministic, and easy to explain in a board meeting. The problem is that the click only captures the final step. Most of the work your media does happens before anyone clicks anything. If your measurement only sees clicks, you have a structural blind spot across the majority of your channel mix.

What does click measurement capture and where does it break down?

Click measurement is a methodology that tracks conversions following a user clicking on an ad, typically within a defined attribution window. Last-click attribution, Data-Driven Attribution (DDA), and Multi-Touch Attribution (MTA) primarily fall within this family, though some DDA implementations incorporate limited view-through signals, the foundational input remains click-path data.

Click measurement works well in specific contexts. For demand capture channels - paid search, shopping ads, retargeting - where user intent is already high and the click is a meaningful signal, it provides a fast and reliable view of lower-funnel efficiency. A user searching "running shoes" clicks a Google Shopping ad and buys. That sequence is real, and crediting the click makes sense.

The structural limitation appears when click measurement becomes the only lens for judging performance across the entire channel mix. Upper-funnel channels - Meta, TikTok, YouTube, Pinterest, Snapchat - work through awareness, reach, and repeated exposure. The Meta video that sparked curiosity, the TikTok ad that drove a brand search days later: these rarely receive a click at the moment of exposure. When the conversion eventually happens, it often arrives through branded search or direct visit. Last-click credits search. The channel that built the demand gets nothing.

Fospha's data, consistent with the broader direction of industry research, shows that awareness and discovery channels are consistently more influential than click-based reports suggest, often by a material margin. That missing value does not disappear - it gets reassigned to whichever channel captured the final click.

Privacy changes compound the problem. Since iOS 14, third-party cookies and pixels capture fewer events. Click-path data now represents a partial record of what tracking allows, not the full picture of how customers actually behave.

How does impression measurement capture what clicks miss?

Impression measurement is the practice of quantifying the contribution of ad exposures - views, video completions, display impressions - to downstream conversions, using statistical modeling rather than click-tracking.

Rather than following individual user click paths, impression measurement uses a Media Mix Model (MMM) to analyze the relationship between media investment patterns and conversion outcomes across the full channel mix. When Meta spend increases and conversions follow, even if those conversions arrive via branded search, the model can attribute a share of that effect to Meta.

This is where impression measurement earns its value for channels like TikTok and YouTube. The majority of users who convert after exposure to a TikTok ad will typically never have clicked that ad directly. They might remember the brand, search for it later, or buy the next time they encounter it. A click-based model sees none of this. An impression-led model does - by measuring the relationship between exposure and outcomes at the aggregate level, accounting for lag, seasonality, and cross-channel effects.

Impression measurement also captures halo effects: the way that advertising on one channel drives sales through another. Meta campaigns driving Amazon purchases. TikTok ads lifting DTC conversions. These cross-channel dynamics are invisible to click-based measurement and are only quantifiable through impression-led modeling.

Why does using clicks alone distort your channel mix decisions?

The downstream consequence of over-relying on click data is systematic underinvestment in upper-funnel channels. When your measurement credits clicks and TikTok drives mostly views rather than clicks, your data makes a case for reducing it. Budget shifts toward search and retargeting, channels that look efficient because they are capturing demand built by the channels that were reduced.

This is the bottom-funnel feedback loop: spend concentrates on demand capture, the pool of demand it's capturing shrinks over time, acquisition costs rise, and growth stalls.

Clicks show demand capture. Impressions show demand creation. Neither alone gives the full picture, but a measurement approach that combines both gives retail eCommerce brands a reliable, daily view of what is actually driving growth across the full funnel.

How to stop optimizing for the last click and start measuring the full picture

The practical answer is a measurement model that treats clicks and impressions as complementary signals rather than alternatives.

Fospha's Core, its always-on Daily MMM, is built on exactly that: an ensemble approach that unifies both signals, updated every 24 hours at the ad level.

The model works in layers. Click-based data from GA4 and paid channels forms the lower-funnel foundation. Impression and engagement data from Meta, TikTok, YouTube, and other upper-funnel channels are layered on top to estimate their incremental contribution and halo effects - including cross-marketplace impact such as Meta ads driving Amazon sales. Results are reconciled to eCommerce sources of truth like Shopify, so model outputs align with observed business performance rather than estimated proxies.

Crucially, the model retrains daily. Rather than producing a quarterly view that arrives too late to act on, Core gives brands a fresh, validated read of cross-channel performance every morning - at the ad level, across every channel in the mix.

The practical consequence: upper-funnel channels get credited for what they actually do. Using Ad Platform ROAS as the benchmark, the same metric available to all brands regardless of measurement approach, Fospha clients achieved on average 30% higher ROAS in 2024, benchmarked against Varos data covering thousands of eCommerce brands spending more than $100k per month across Meta, TikTok, and Google. That gap is in large part because their measurement sees the full picture of what is driving growth, not just the final click.

Fospha's Glassbox commitment means every stage of the model is transparent and explainable, so marketing and finance can interrogate the numbers and make budget decisions from a shared, trusted view.

Common questions

Q: Can I just use view-through attribution instead of impression measurement?

View-through attribution assigns credit to ad impressions within a defined lookback window, typically 1 to 7 days. It is a step beyond pure click measurement, but it has structural limits: it does not model the statistical relationship between spend levels and outcomes, and ROAS figures shift significantly depending on the window length chosen, with no universally agreed methodology for selecting the right one. An impression-led MMM avoids this by modeling contribution through spend-outcome patterns across the full channel mix rather than assigning credit through individual lookback windows.

Q: How do clicks and impressions work together in practice?

They serve different purposes and are most powerful when combined. Click data powers day-to-day tactical optimization: audience testing, creative iteration, lower-funnel efficiency. Impression-based modeling informs strategic budget allocation: which channels create demand, what cross-channel halo effects exist, how to invest across the full funnel. Unified measurement - where both signals feed a single daily model - is what allows marketing and finance to align on budget decisions rather than argue from different data sources.

Q: Why does last-click show paid search as the top performer if impressions drive so much value?

Because last-click credits the final interaction before conversion, and paid search, particularly branded search, is often the last step before purchase. But many branded search conversions are the downstream effect of awareness built by upper-funnel channels. A user sees a TikTok ad, searches the brand name a day later, clicks the branded search ad, and buys. Last-click gives all credit to branded search. Impression-led measurement shows TikTok started the sequence. Both are partially right; only a unified model shows the full picture.

Q: Does impression measurement require pausing spend to run tests?

No. Unlike geo-based incrementality tests, which require holding out spend in certain regions to measure lift, impression-led MMM operates always-on. It measures the relationship between media investment and outcomes continuously, across all live campaigns, without any sacrifice of spend. Incrementality tests remain a valuable complement, Fospha ingests test results to calibrate and strengthen the model over time, but they are not a prerequisite for getting impression-level measurement running.

Related reading

See how Fospha works in practice. 30-minute walkthrough on your data, your channels, this quarter.

Book a demo

How do you measure model accuracy?

The short answer

Model accuracy in a marketing mix model is not a single number - it is a framework of complementary signals evaluated continuously. The three core components are nRMSE (Normalized Root Mean Squared Error), which measures predictive error; R², which reflects how well the model explains historical variance; and back-testing, which validates at key checkpoints whether the model generalizes reliably to data it has not seen. No single metric is sufficient on its own. Used together, and monitored over time rather than at a single point, they give a robust and transparent picture of model performance.

Marketing mix models guide some of the largest budget decisions a performance team will make. The natural question follows: how do you know the model is actually accurate? And how do you make that accuracy visible and verifiable to finance, leadership, and external stakeholders?

Accuracy, properly measured, requires multiple complementary perspectives - different metrics reveal different things about how a model is performing.

Why does measuring model accuracy require more than one metric?

Evaluating a model's accuracy comes down to two distinct questions that pull in different directions.

The first is how well the model learns from historical data - how closely its outputs match the patterns already in the training set. The second is how well it performs on data it has not seen - whether the relationships it has learned hold up in genuinely new periods.

These two questions reflect what is known in statistics as the bias-variance tradeoff. The bias-variance tradeoff is the tension between a model that learns too rigidly from historical data and one that is too loose to be reliable - finding the right balance is central to building models that perform consistently on new data. A model that fits historical data too closely tends to absorb noise rather than meaningful structure - and when the environment shifts, its predictions become unreliable. A model with a slightly imperfect fit on training data can be the more reliable choice if its predictions remain stable on genuinely new periods.

This is why a sound accuracy framework uses both performance metrics, such as nRMSE and R², and out-of-sample validation through back-testing. Each provides a signal the others cannot.

What does each accuracy metric actually measure?

Normalized Root Mean Squared Error (nRMSE) is a measure of predictive error - how closely the model's predictions align with observed outcomes. It is calculated by dividing RMSE by the mean of observed outcomes, which makes the metric comparable across brands and scales. Other normalization conventions exist, such as using the range or standard deviation, so it is worth confirming definitions when comparing providers.

Normalized Root Mean Squared Error (nRMSE)

nRMSE is most usefully read as a trend rather than a single number. A low, stable nRMSE time series is a strong signal of dependable predictive performance. A rising or erratic nRMSE trend may indicate the model is drifting or that the underlying data environment has shifted - a signal worth investigating.

represents the proportion of variation in the outcome that the model can explain based on its inputs. A practical way to read it: an R² of 0.90 means the model accounts for roughly 90% of the rises, dips, and shifts in your historical sales data.

R² reflects in-sample fit - how well the model captures patterns in the training data - rather than predictive accuracy on new data. In time-series settings, R² can appear artificially inflated due to trends, seasonality, non-stationarity, or data leakage, so it is best read alongside out-of-sample metrics such as nRMSE. High R² with weak predictive accuracy can indicate over-fitting. Moderate R² with strong predictive accuracy can reflect a well-calibrated model operating in a genuinely complex, noisy environment.

Back-testing is a form of out-of-sample validation that evaluates how well the model generalizes to unseen future periods, preserving the time order of the data. It is typically run at key checkpoints - such as model build or retraining - rather than as a continuously updated signal. At its simplest, it involves comparing model performance between the periods it learned from and the future periods it has not seen. If performance degrades on the unseen periods, it may indicate over-fitting or instability. If performance remains consistent, it suggests the model has learned meaningful structure rather than memorizing historical noise. Back-testing adds a layer of confidence that the model will behave reliably in real-world, forward-facing conditions.

Inside the Glassbox

Accuracy is a continuous discipline at Fospha, not a one-time check. This sits inside Glassbox - Fospha's commitment to full transparency across every modeling layer. Every model layer, validation step, and metric is open to inspection. Customers can see how the ensemble model is constructed, how different measurement components contribute (click measurement, impression measurement, post-purchase, halo), the validation metrics behind every prediction, and the daily, ad-level outputs those decisions rely on.

Building the Full Funnel View

In practice, each modeling cycle follows a structured loop: data refresh and retraining; evaluation on held-out periods to assess generalization; ongoing monitoring of nRMSE and R² to track predictive error, model fit, and stability over time; and transparent reporting, with accuracy measures available to customers on request.

nRMSE is computed daily for every model Fospha runs, including click-based components and impression-based MMM, so performance is continuously visible. Accuracy metrics are available to customers on request and typically shared via their CSM, complete with plain-English definitions and guidance, so model health is straightforward to understand and verify without requiring statistical expertise.

Healthy accuracy ranges are brand-specific and derived empirically. The goal is not a single universal benchmark, but a stable band for each brand that signals the model is learning meaningful structure and generalizing reliably over time.

Common questions

Q: What is a good nRMSE score for a marketing mix model?

There is no universal benchmark - healthy nRMSE ranges are brand-specific and derived empirically based on the data environment and business context. The more useful signal is the trend over time: a low, stable nRMSE series indicates dependable predictive performance, while a rising or volatile trend warrants investigation. A single low score at one point in time is less informative than consistent stability across many measurement periods.

Q: Can R² alone tell me if my MMM is accurate?

No. R² reflects in-sample fit - how well the model explains historical patterns - but it does not tell you whether those relationships will hold on new data. In time-series settings, R² can be artificially inflated by trends, seasonality, non-stationarity, or data leakage. A high R² alongside weak out-of-sample performance is a sign of over-fitting. R² is best read alongside predictive accuracy metrics such as nRMSE and validated through back-testing.

Q: What is back-testing and why does it matter for MMM?

Back-testing is out-of-sample validation that checks whether a model generalizes beyond the data it was trained on. It works by evaluating model performance on future periods the model has not seen, preserving the time order of the data. If performance degrades significantly on those unseen periods compared to the training period, it may suggest the model has over-fitted to historical noise. Consistent performance across both periods is a positive indicator that the model has learned genuine, stable structure - and is more likely to produce reliable outputs in real-world conditions.

Q: How often should model accuracy be monitored?

Continuous monitoring is more reliable than periodic checks. Marketing environments shift - media mix changes, spending levels fluctuate, audience behavior evolves. A model calibrated under one set of conditions may drift as those conditions change. Tracking metrics such as nRMSE on a daily basis, rather than waiting for quarterly model refreshes, makes it possible to detect and address emerging issues early.

Related reading

Can an MMM provide reliable guidance at the ad or creative level?

The short answer

A pure Media Mix Model is not designed to evaluate individual creatives - the statistical conditions required for that level of precision rarely exist. But that does not mean creative decisions should be made without full-funnel context. A modern Daily MMM, scoped to the right level and combined with platform-native signals, can provide reliable directional guidance for creative prioritization without overstating what the data can support. The goal is better decisions, not more granular numbers.

Creative is one of the most actively managed levers in paid media. Decisions about which ads to scale, which concepts to cut, and which formats are building demand versus capturing it happen every week, if not daily. The question most performance teams eventually ask is: can our MMM help us make those calls more accurately?

The answer is nuanced, and getting it wrong in either direction creates real problems. Dismiss the question entirely and creative decisions get made on click-based signals that have well-documented limitations which  compound over time. Overstate MMM precision at the ad level and the outputs become unstable, eroding the trust the measurement function depends on.

Why does a pure MMM struggle at the individual ad level?

A Media Mix Model (MMM) is a statistical technique that uses aggregated input and outcome data to estimate the contribution of different marketing activities to revenue. It is designed to detect patterns that are visible at the level of channels, objectives, and time periods - not individual ads.

Three structural constraints explain why extending a pure MMM to the creative level tends to produce unreliable outputs.

  1. Parameter growth. Introducing hundreds or thousands of individual creatives into a model dramatically increases the number of parameters it must estimate. Without enough independent variation in the data to support each parameter, the model becomes unstable - small changes in inputs produce large swings in outputs.
  2. Correlation within platforms. Creatives within the same platform tend to move together. They share budgets, targeting, auction dynamics, and delivery systems. This makes it statistically difficult to separate the relative contribution of individual ads from aggregate campaign performance.
  3. Cadence mismatch. Many traditional MMMs refresh on monthly or quarterly cycles. Creative performance changes much faster than that. Insights that arrive six weeks after a campaign has rotated out are not useful for the creative decisions being made today.

For these reasons, applying a pure MMM directly at the ad level is generally not statistically reliable.

Why does full-funnel context still matter for creative decisions?

The limitation of pure MMM at the creative level does not make full-funnel measurement irrelevant to creative decisions. It makes it essential.

Without full-funnel context, creative performance is easy to misread:

  • A prospecting video may reduce site conversion rate while actively contributing to broader demand generation. Click-based signals will penalize it; full-funnel measurement will credit it correctly.
  • An upper-funnel creative may appear inefficient in platform reporting while influencing downstream revenue across a longer window.
  • Two creatives may look similar in-platform yet behave very differently once cross-channel effects are accounted for.

Teams that rely solely on lower-level signals tend to bias their decisions toward demand capture. They optimize toward what is easiest to measure, not what is most effective. The result is a media mix that is typically underweighted toward upper-funnel and demand generation channels.

How does a modern daily MMM approach the ad level?

The answer is a deliberate hybrid, where each signal does the job it is best suited for.

MMM at the level it is strongest. Fospha's Daily MMM focuses cross-channel, full-funnel measurement at the campaign type or objective level across platforms and markets. At this level, there is sufficient independent variation in the data to produce outputs that are stable over time, comparable across channels, and suitable for budget and planning decisions.

Platform signals for finer-grained views. Below the campaign level, the signal changes. Publishers have strong visibility into engagement, delivery, and auction dynamics within their own platforms. Fospha uses these intra-platform signals to allocate campaign-level MMM outputs down to individual ads.

The result is ad-level views that are:

  • grounded in cross-channel, full-funnel measurement
  • informed by platform-native signals where those signals are most reliable
  • consistent enough over short operating windows to support prioritization decisions

These views are designed for decision support, not for precise estimation of individual ad effects. The distinction matters. Decision support tells you which creatives are worth scaling and which should be rotated out, within a frame that reflects total business impact. Precise estimation makes claims about individual ad contribution that the data simply cannot support at that resolution.

How Fospha's Core separates measurement from allocation

Fospha's Core, the always-on Daily MMM, addresses this by clearly separating where measurement is most reliable from where allocation and prioritization are more appropriate.

At the campaign type and objective level, Core provides cross-channel, full-funnel measurement with the statistical stability needed to inform budget decisions. This is the frame teams use to understand whether their creative investment is building demand or primarily capturing existing intent.

At the ad level, Core allocates campaign-level measurement outputs using platform-native signals, producing directional views that are grounded in full-funnel context without overstating precision. A creative that looks inefficient in last-click reporting gets evaluated in the context of what the MMM shows is happening across the full channel path.

The practical outcome is that creative teams can make rotation, scaling, and investment decisions with more than just in-platform data behind them, and with less risk of undervaluing the upper-funnel formats that drive long-term growth.

Common questions

Q: If MMM can't precisely measure individual ads, does that mean ad-level data from an MMM is unreliable?

Ad-level outputs from a well-designed hybrid MMM are reliable for directional decisions, but they should not be treated as precise point estimates of individual ad contribution. The appropriate use is prioritization and rotation decisions within a full-funnel frame, not granular performance measurement at the creative level. The distinction between decision support and precise estimation is what makes the outputs trustworthy.

Q: What happens if a team relies only on platform signals for creative decisions?

Platform signals are useful for understanding delivery dynamics and in-platform engagement, but they have predictable blind spots. They bias decision-making toward demand capture - the bottom-funnel activity that is easiest to observe. Upper-funnel and prospecting creatives are typically undervalued. Teams that rely heavily on these signals risk improving in-platform metrics while reducing broader marketing efficiency, particularly if upper-funnel spend is cut in the process.

Q: How often does ad-level measurement need to update to be useful for creative decisions?

Creative performance changes quickly - campaigns rotate, budgets shift, auction dynamics evolve week to week. Measurement that refreshes quarterly arrives too late to inform the decisions that have already been made. Daily MMM updates, which are standard in Fospha's Core, close the gap between when something changes in the media mix and when measurement reflects it. For creative decisions, daily cadence is the difference between acting on current data and optimizing against a picture that is already out of date.

Can I access Fospha data through my AI tools?

Yes. Fospha MCP connects your Fospha measurement directly to AI tools like Claude and ChatGPT - so you can ask questions about your performance data in plain language and get answers back in seconds, using the same data that's in your Fospha dashboard. No login required.

MCP works with Claude and Cursor today, with ChatGPT and Perplexity coming next. You'll need an enterprise AI account (Claude for Work, ChatGPT Enterprise, or equivalent) to connect it.

Speak to your account manager to get set up.

What does the Fospha onboarding process look like?

Getting started with Fospha is quick and painless—most of our clients are up and running in less than 28 days with minimal effort.

All we need is admin access to your ad accounts, Google Analytics, and eCommerce platform—no coding or IT department needed!

Here's how it works:

- Initial Setup (about 3 hours): We'll help you connect your data through our easy-to-use onboarding portal.

- Data Validation (1-2 weeks): We'll verify your connections while you review initial insights for accuracy.

- Go-Live (by Day 28): You're all set! Full platform access with 24 months of historical data immediately available.

Your team includes an Onboarding Specialist for setup, a Customer Success Coordinator for ongoing support, and an Account Manager to help turn insights into growth opportunities

How long does it take to get started with Fospha?

Fospha delivers the fastest time-to-value in marketing measurement, with most clients fully live in under 28 days.

Your onboarding timeline:

- Setup (3 hours): Connect your ad platforms, GA4, and eCommerce data via our easy-to-use Onboarding Portal.

- Data Validation (1-2 weeks): We reconcile and verify your data for accuracy, ensuring seamless measurement.

- Go-Live (by Day 28): Access 24 months of historical data from day one and start optimizing your performance immediately.

How do I know your model is accurate?

We take accuracy seriously. Our model undergoes daily quality checks to ensure reliable, fair measurement you can trust. Here's how we ensure accuracy:

- Data Validation First: Before anything enters our model, we verify your tracking is consistent across platforms, identify any gaps between channels, and run daily checks to confirm outputs align with expected patterns.

- Historical Back-Testing: We prove our value by showing how our model would have accurately predicted your past performance trends, giving you confidence our recommendations are reliable.

- Outlier Capping: During major sales events like Black Friday, ad platforms typically over-claim credit. Our system automatically adjusts the outputs on high-traffic days to maintain a fair picture of what's really driving results.

Is Fospha privacy safe?

Yes, Fospha is built for privacy-first measurement, today and in the future.

For 10+ years, we've led the shift away from pixel-based tracking, building our solution to meet global privacy standards like GDPR, CCPA, and iOS14+, and preparing for changes like Google’s Privacy Sandbox.

Here’s how we do it:

No third-party cookies or user-level tracking: Our model doesn’t rely on personal identifiers or outdated tracking methods

- Privacy-first by design: Fospha combines always-on measurement signal with Daily MMM to restore visibility lost to privacy changes—without compromising compliance

- Proven compliance: Trusted by global brands across the US, UK, and EU, Fospha meets the highest privacy standards

How is Fospha different from traditional MTA, MMM, and other marketing measurement solutions?

Fospha uniquely combines the best of both worlds by unifying always-on measurement signal with Daily MMM - something our competitors simply don't offer.

While platform-native dashboards miss upper-funnel impact due to signal loss, and traditional MMM lacks the speed and granularity for daily decisions, we deliver:

- The granular, ad-level measurement insights for tactical optimization

- The predictive power and total channel visibility of our Daily MMM, fairly crediting both demand generation and capture channels

Our unified approach, refined through 10+ years of working with hundreds of brands, corrects the common measurement bias toward last-touch channels - properly valuing the complete channel mix from awareness to conversion.

Which channels does Fospha measure?

Fospha measures your entire channel mix, from brand awareness to conversions, giving every channel fair credit using privacy-safe Daily MMM.

We cover everything that drives growth - across web, app, and Amazon - and unify it into a single, unbiased view.

What sets us apart:

- Halo Effect: Reveal how Meta, TikTok, and Google ads drive sales on Amazon - with unified ROAS across DTC and marketplace

- TikTok Shop: Track in-app and on-site purchases together, giving you full visibility into TikTok performance beyond what Google Analytics can capture

- App Sales: We model app and web sales separately to reflect how customers behave on each platform

With Fospha, you measure what matters - no blind spots, no wasted budget, just smarter growth.

How soon will I see value from Fospha?

Immediately.

Fospha gives you full-funnel, privacy-safe measurement from day one—so you can optimize spend, measure true channel impact, and make smarter decisions faster. Here's how different teams benefit from Fospha from day 1:

For Performance Marketers & Growth Teams:

- Stop wasted spend & scale smarter – Use Spend Strategist to forecast ROAS, conversions, and revenue at different spend levels—helping you scale efficiently.

- Optimize within & across channels – Get ad-level insights to improve performance and shift budgets strategically, even when direct reallocations aren’t possible.

For Marketing & Finance Leaders:

- Confident, bias-free reporting – Move beyond last-click limitations with independent, privacy-safe measurement trusted by CMOs and CFOs.

- Smarter budget decisions – Use Spend Strategist to forecast the most efficient spend levels before committing budget.

- See the full impact of marketing – Get daily, MMM-powered insights that quantify brand-building and performance marketing together.

No blind spots, no wasted budget - just better decisions from the very start.