Overview
The most complete, full-funnel measurement platform
Core
Full-funnel, always-on, granular measurement
Beam
Incremental forecasting for profitable growth
Halo
Unified measurement of DTC and marketplaces
The measurement OS built for automation
See the solution
Shipping at the pace of change. Updated weekly.
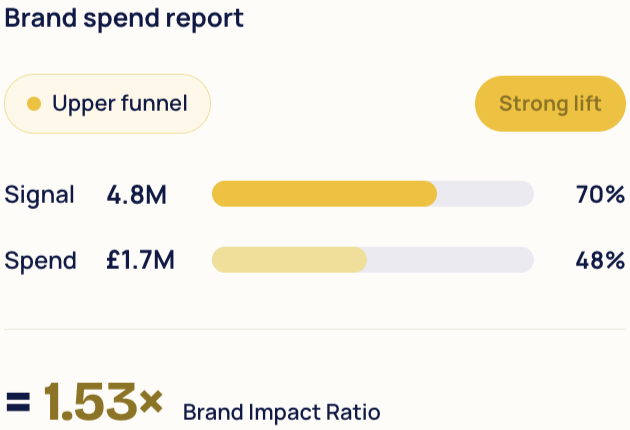
Total Measurement Integration
On the horizon
Walmart.com is the second-largest e-commerce marketplace in the US - and for brands expanding beyond DTC, it's a fast-growing share of revenue that currently sits outside the measurement model. Walmart.com Halo changes that, bringing Walmart Marketplace into Fospha's unified framework alongside DTC, Amazon, and TikTok Shop. Invest in Walmart with the same confidence as every other channel.
For beauty brands, Sephora is often the biggest sales destination in the mix - but measurement has yet to keep pace. Sephora Halo brings daily Sephora sales into Fospha's Measurement OS for online retail, so you can see how your paid media drives Sephora conversions alongside DTC and Amazon. Total Commerce measurement, extended to where beauty actually sells.
Next
Amazon DSP builds awareness that converts through Sponsored Products days later. Without measurement that follows that journey, DSP gets miscredited and budget conversations stall. Amazon DSP Measurement brings DSP into Fospha's attribution model alongside your full Amazon advertising stack - so you see how it actually performs, and invest accordingly.
Programmatic spend is growing - but without measurement, it sits outside your channel mix, excluded from every budget conversation. StackAdapt Measurement brings Display, Video, CTV, Audio, and Native into Fospha's full-funnel measurement OS - so you can compare programmatic fairly against your entire mix, and invest in it with the same confidence as every other channel.
TV investment is significant. Proving it's working is harder. Tatari Measurement brings both CTV streaming and linear broadcast into Fospha's unified attribution model - capturing impression-level signals that your performance stack currently can't see. So when TV is driving conversions, you'll know. And when you're planning the next budget cycle, it's in the model alongside everything else.
Measurement OS - Actionability
Measurement that moves at the speed your stack demands. The Fospha MCP gives your agents and AI tools direct programmatic access to your entire Fospha Measurement OS - queryable and ready to act on, without leaving the tools you rely on every day.
Live
-
January 2026
The Onboarding Portal brings the entire setup journey into Fospha dashboards giving clients a clear self-service flow to connect their integrations, and giving your team real-time visibility at every stage - so your first insights land sooner.
Retail Intelligence & Benchmarks
Beta
You know how your channels are performing. Benchmarking shows how they perform relative to the best. Drawing on Fospha's network of hundreds of leading retail brands, it surfaces how your Share of Wallet and Channel Mix compares to peers — so every budget decision is grounded in industry-specific insights.
Enterprise brands on Adobe Analytics have had to choose between their analytics stack and access to full-funnel measurement. The Adobe Analytics Integration removes that trade-off - connecting Fospha directly to your Adobe data so you get the same impression-led, always-on MMM that Shopify and GA4 brands rely on. No migration required. No compromise on measurement quality.
Markets move fast, but budgets rarely do. Budget Planner automates Fospha’s Incremental Forecasting into clear, guided budget reallocation recommendations across your channel mix - so teams can move from “what happened?” to “what should we do next?”
When conversions happen across DTC, App, TikTok Shop, and Amazon, understanding which channel drove them, and where, is essential for confident investment. Sales Channel Segmentation lets you break attributed conversions down by sales channel directly in Fospha, so performance data is sharp, actionable, and easier to act on at the channel level.
Your lift tests shouldn't live in a spreadsheet while your MMM runs on different assumptions. Lift Test Calibration brings your experimental results directly into Fospha's always-on model - so your budget decisions are grounded in a single, consistent view of what's actually working.
A drag-and-drop builder that combines Fospha's base metrics into any metric your team runs on. Name it, set it, and it appears across your dashboards, updating daily.
Your wider data stack - BI tools, data warehouses, internal dashboards - is where decisions get made. The Fospha API gives you programmatic access to Fospha performance data so it flows directly into Snowflake, Google BigQuery, or wherever your teams already work. Centralize measurement alongside GA, ad platform, and internal business data, without leaving the reporting environment you've already built.
Brand investment drives long-term growth, but quantifying that in a way that holds up in a budget conversation is a persistent challenge. Glow uses causal modelling to measure the quantitative relationship between brand spend, leading indicators, and revenue growth over time. The result is CFO-credible evidence that brand investment works — so you can justify the budget, not just advocate for it.
Prism connects Fospha's daily MMM-led attribution directly to Smartly's Predictive Budget Allocation, so budgets automatically shift to the campaigns driving real incremental impact - not just platform-reported conversions. Strategy gets executed consistently, across campaigns, channels, and markets, without manual intervention.
March 2026
GMV Max drives conversions across TikTok Shop, web, and Amazon - but capturing the full impact across all three requires measurement built for the way the channel actually works. Fospha's GMV Max Measurement captures the impression-level impact of GMV ads on both TikTok Shop orders and Shopify revenue. Compare GMV Max directly against your other paid channels, and invest in it with the same confidence you bring to everything else.
Measurement OS - Agents & AI
February 2026
Understanding a ROAS shift requires pulling data across platforms, identifying the contributing factors, and forming a clear view of what to do next. The Spark ROAS Agent does that work automatically - analysing performance data across campaigns, identifying which factors are driving the movement, and surfacing clear recommendations. Less time diagnosing, more time acting.
August 2025
Knowing a campaign is performing well is the starting point - knowing which creatives are doing the work is where optimization happens. Google Ad-Level Measurement brings Fospha attribution down to the individual ad for Video, Display, and Demand Gen campaigns. Identify the assets driving results, allocate budget with precision, and - for Smartly users - feed those signals straight into Predictive Budget Allocation.
Shopify Revenue Customization lets clients choose how Fospha calculates revenue (Gross, Net, or Total) to match their internal reporting, ensuring that Fospha's revenue reporting matches your internal source of truth.
Acquisition and retention look very different on a balance sheet, but most ROAS metrics treat them the same. New Customer ROAS tracks how efficiently your spend is bringing in first-time buyers - so you can see whether campaigns are growing your customer base or recycling existing demand. Defend acquisition budgets with a metric that tells the real growth story.
Measurement OS - Trust
The more confident you are in how your measurement is built, the more defensible it is to your CFO. Model Spotlight gives you a step-by-step view of exactly how Fospha constructs its outputs - from GA4 baseline through reconciliation and impression measurement to final conversion figures. Every number is traceable, every decision is visible, and your measurement becomes something you can explain and defend to any stakeholder.
September 2025
High-pressure periods like Black Friday or board reporting cycles move fast. Saved Views lets you lock in your exact dashboard setup - filters, date ranges, layouts - and reload it instantly. Every team member works from the same view and YoY comparisons are there when you need them.
Built-in period-on-period comparisons surface percentage change and previous values across summary tables and exports, allowing you to spot trends quickly and simplify reporting.
November 2025
Advertising works across time - an impression served today may drive a conversion next week. And no channel operates in isolation from offline investment. Measurement 3.0 captures both. Ad-stock models how impressions continue driving conversions long after they're served. Total Budget Calibration incorporates offline spend so each channel is evaluated against its real share of wallet. Enhanced Model Fitting Controls tighten accuracy through volatile periods. The result: outputs that are stable, precise, and reflective of how your full marketing mix actually works.
Performance charts show you what happened. Context tells you why. Annotations lets you attach notes - campaign launches, promotions, brand moments - directly onto performance charts in Reporting and Optimization. When you're reviewing results weeks later or running a YoY comparison, the full picture is already there for every team that needs it.
Your key performance metrics are spread across dashboards, platforms, and decks — and everyone's working from a slightly different version. The Home Dashboard gives you a single, customizable view of the KPIs that matter most to your team, built the way you actually report. Move from signal to action faster, and keep growth, performance, and leadership aligned on the same numbers every day.
How the strongest retail commerce brands will execute record-breaking performance in 2026