Why is Black Friday won in Q1, not Q4?
Top-quartile brands don't switch on upper-funnel spend for peak, they hold it above 20% all year round. Here's the client data behind why Q4 is won early.
All
Learn More

An incrementality test returns a range around a best guess. Learn how to read the range, compare it with break-even and interpret “no significant lift”.
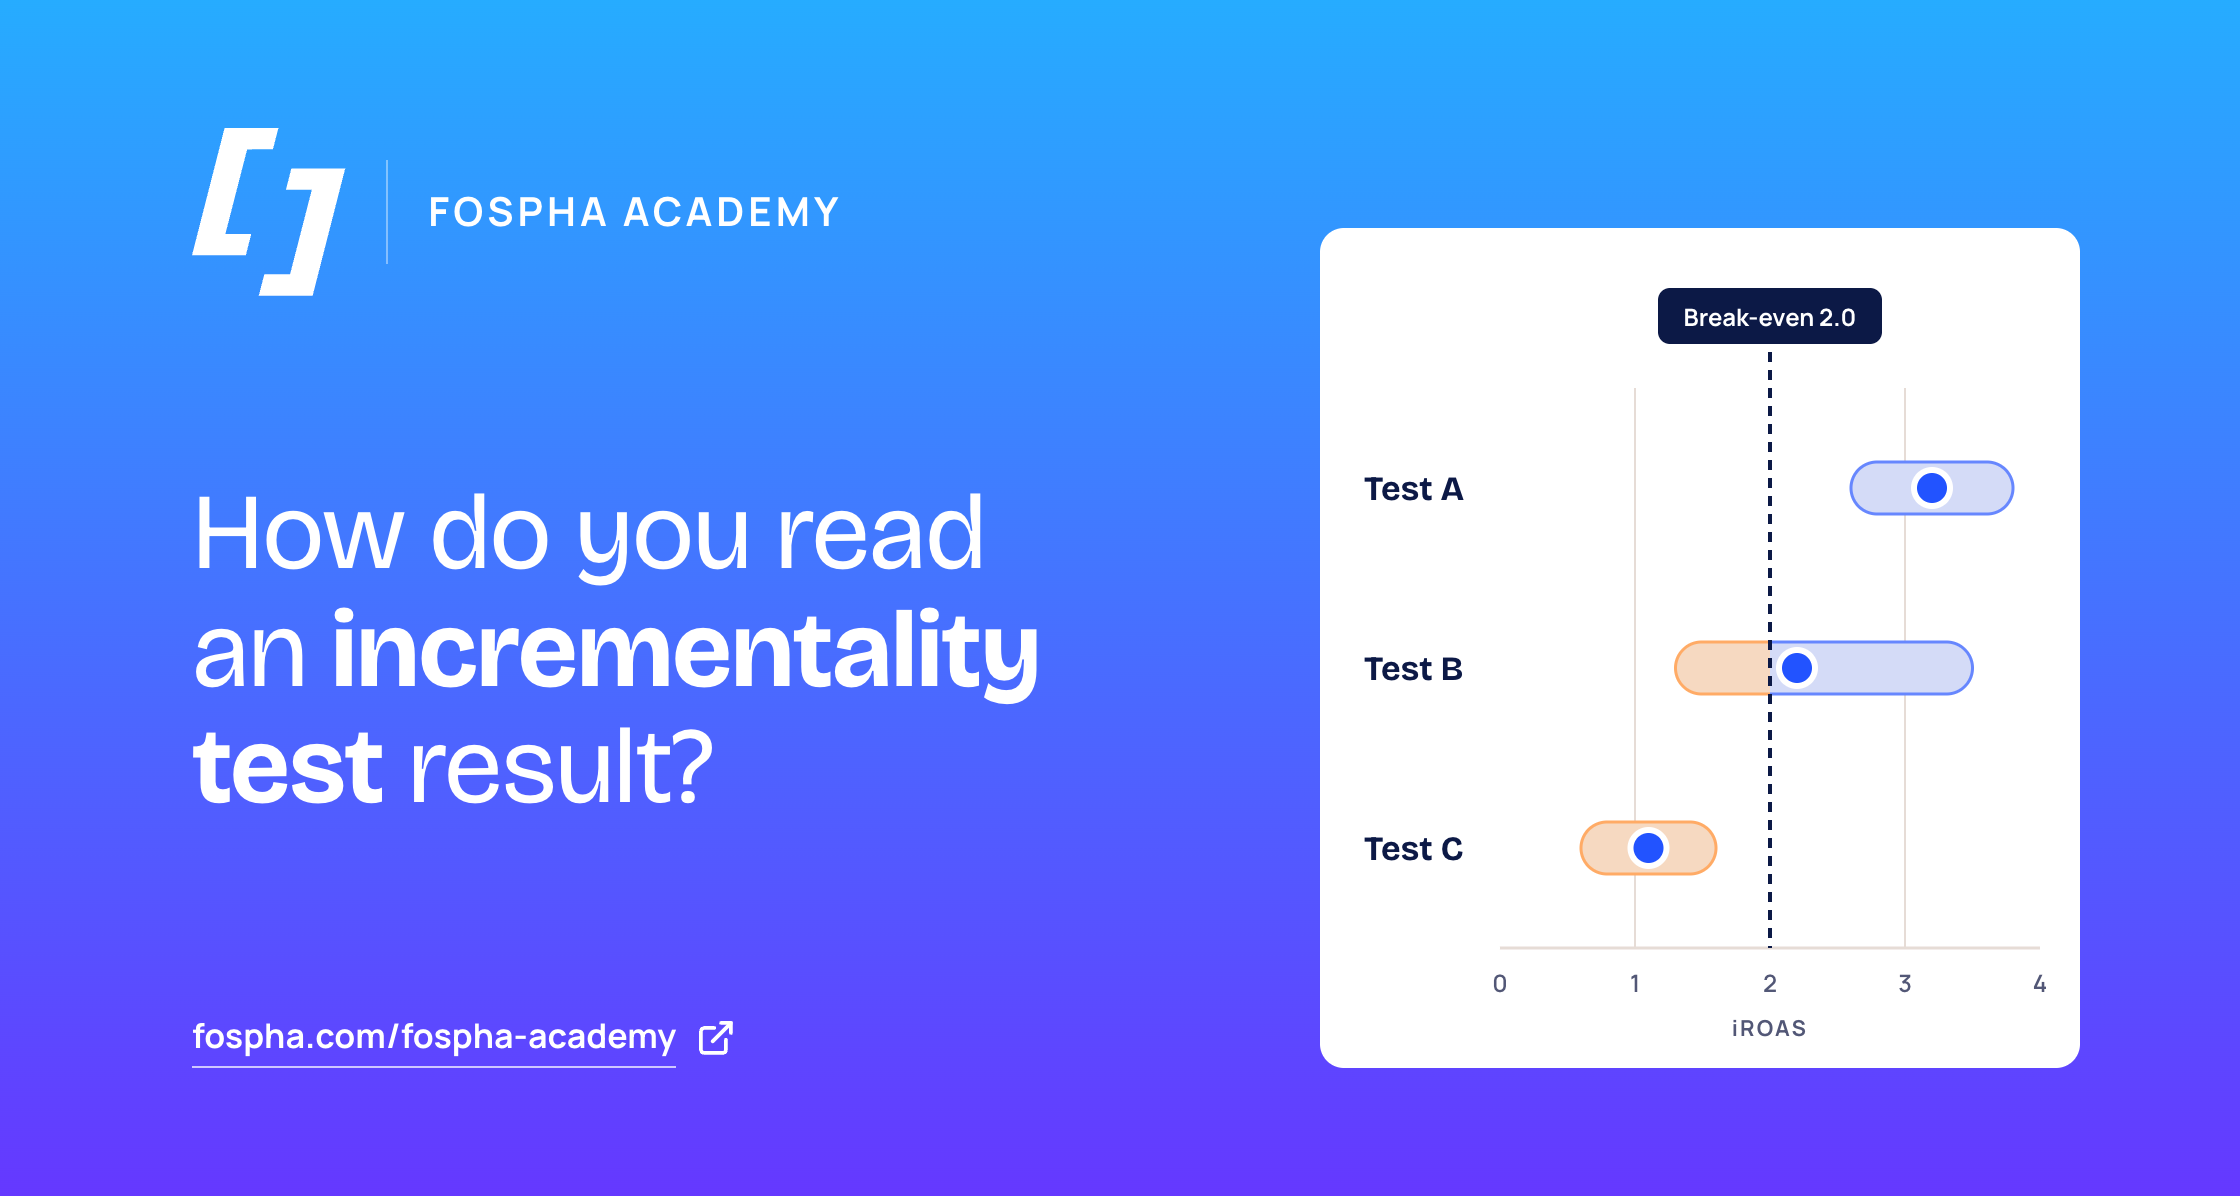
An incrementality test tells you how many extra sales your ads caused. The result comes as a range around a best guess. If part of that range sits below the point where the ads earn back their cost, the test hasn’t settled whether they pay for themselves.
Ad platforms report the sales that followed an ad. Some of those shoppers were already on their way to buy, so the report can’t separate sales the ads caused from sales that would have happened anyway. Any decision to scale, hold or cut a channel depends on that split.
Even a well-run test gives a fuzzy answer, because individual purchases are noisy. A headline like “22% lift” can mislead without the range behind it.
It compares two similar groups: one that sees your ads and one that doesn’t.
The groups can be individual people inside an ad platform, or whole regions such as states or metro areas. The second group, that doesn’t see the ads, is called the control group. The extra sales the first group makes on top of the control group’s are the incremental sales, meaning the ones your ads caused. Our incrementality testing lesson covers the test types.
It works like an election poll: a best guess with a margin of error around it. A result has three parts.
Meta treats a confidence level of 90% or higher as statistically reliable. Google reports 80% credible intervals, and separately aims for 90% certainty that the lift is real. Check which convention a result uses before comparing two studies.
Return on ad spend (ROAS) is revenue divided by ad spend, so $4 of sales for every $1 spent is a ROAS of 4. Platform-reported ROAS counts every sale the platform credits to its ads, including sales that would have happened anyway. Incremental ROAS (iROAS) counts only the sales the ads caused, so the two figures typically differ.
Dividing iROAS by platform ROAS for the same channel gives a correction factor some teams apply to their daily reports. It only describes the spend level and period the test covered, so refresh it when either changes materially.
Break-even is the return at which the extra sales just pay back what you spent on ads. It depends on your gross margin, the share of each sale left after the cost of the product itself.
Take a hypothetical business with a 50% gross margin. Each $1 of sales leaves 50 cents, so it needs $2 of sales per $1 of ads to break even, which makes its break-even iROAS 2.0. The shortcut is 1 divided by your gross margin after returns, before other costs such as shipping and fulfillment.
Then read the whole range against that line:
Google’s documentation on region-based Conversion Lift, which compares ad exposure across geographic areas, gives an example result of an iROAS of 2.2 with a range from 1.3 to 3.5. Against the 2.0 break-even above, the best estimate clears the line but the range dips below it, so the result makes the case for holding spend and running a follow-up rather than scaling. If the platform had reported a ROAS of 4.0 for that channel, it would be about 1.8 times the measured incremental return.
It means the test couldn’t tell the ads’ effect apart from zero at that sample size, which doesn’t mean the ads did nothing. The range shows which case you’re in.
A range from minus 10% to plus 40%, for example, says the test was underpowered: it had too little data to spot a lift of the size you care about. A tight range around zero says the effect is probably small.
A result describes one channel, one spend level and one period.
Recap. An incrementality test shows how many sales your ads caused. Read the result as a range, compare the whole range with break-even (the return at which ads pay for themselves), and treat “no significant lift” as a sign of how much the test could detect. A result applies to one channel, spend level and period.