Measurement that changes what happens next.
future.
economy.
company.
Most measurement has an actionability gap. Fospha closed it. Meet the Measurement OS integrated at the heart of the stack — every ad, every marketplace, delivering thousands of incremental outcomes for leading retail commerce brands, every day.


The Fospha advantage
Measure everything
Measure the full impact of every ad on web, Amazon, TikTok Shop and beyond, every day.

Trust the numbers
See the model work. Validate the outcomes.

Act on it everywhere
End-to-end. From insight to action to incremental impact. Automatically.

Know where to grow next
Benchmarks, forecasting, and market intelligence so brands have the proof to do something completely new.

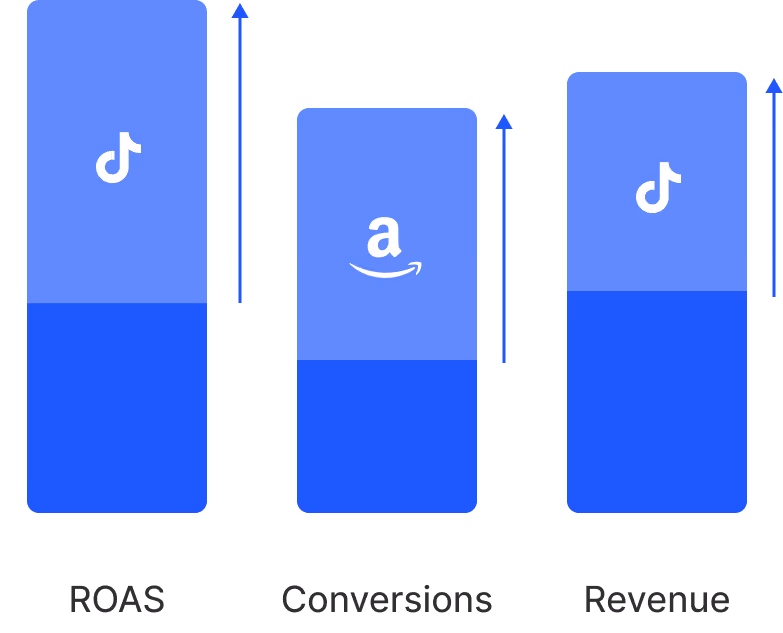
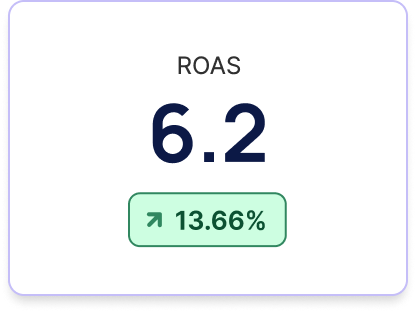
Brands on Fospha's Measurement OS achieve 30% higher ROAS than the market
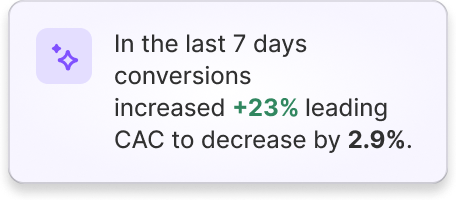
Fospha gives brands the insight to optimize what’s working today - and the confidence to invest in what drives incremental growth tomorrow. Delivering smarter decisions and stronger returns.


.webp)


.jpg)
.png)
Measurement rebuilt for the rate decisions get made.
Calibrated to move beyond correlation.
Corrected for the bias built into click-based measurement.
Traditional Marketing Mix Models
Fospha's Media Mix Model
Pure correlation
Beyond correlation
Quarterly reports
Daily outputs
Channel-level view
Ad-level granularity
Historical and static
Predictive forecasting
Manual interpretation
Automation-ready
Black-box models
Transparent science
One Measurement OS to report, plan, and optimize across every ad, everywhere you sell, every day.
Measure the full impact of every ad — web, Amazon, TikTok Shop and beyond, daily.
Have the proof to do something completely new, from insight to incremental impact. Automatically.
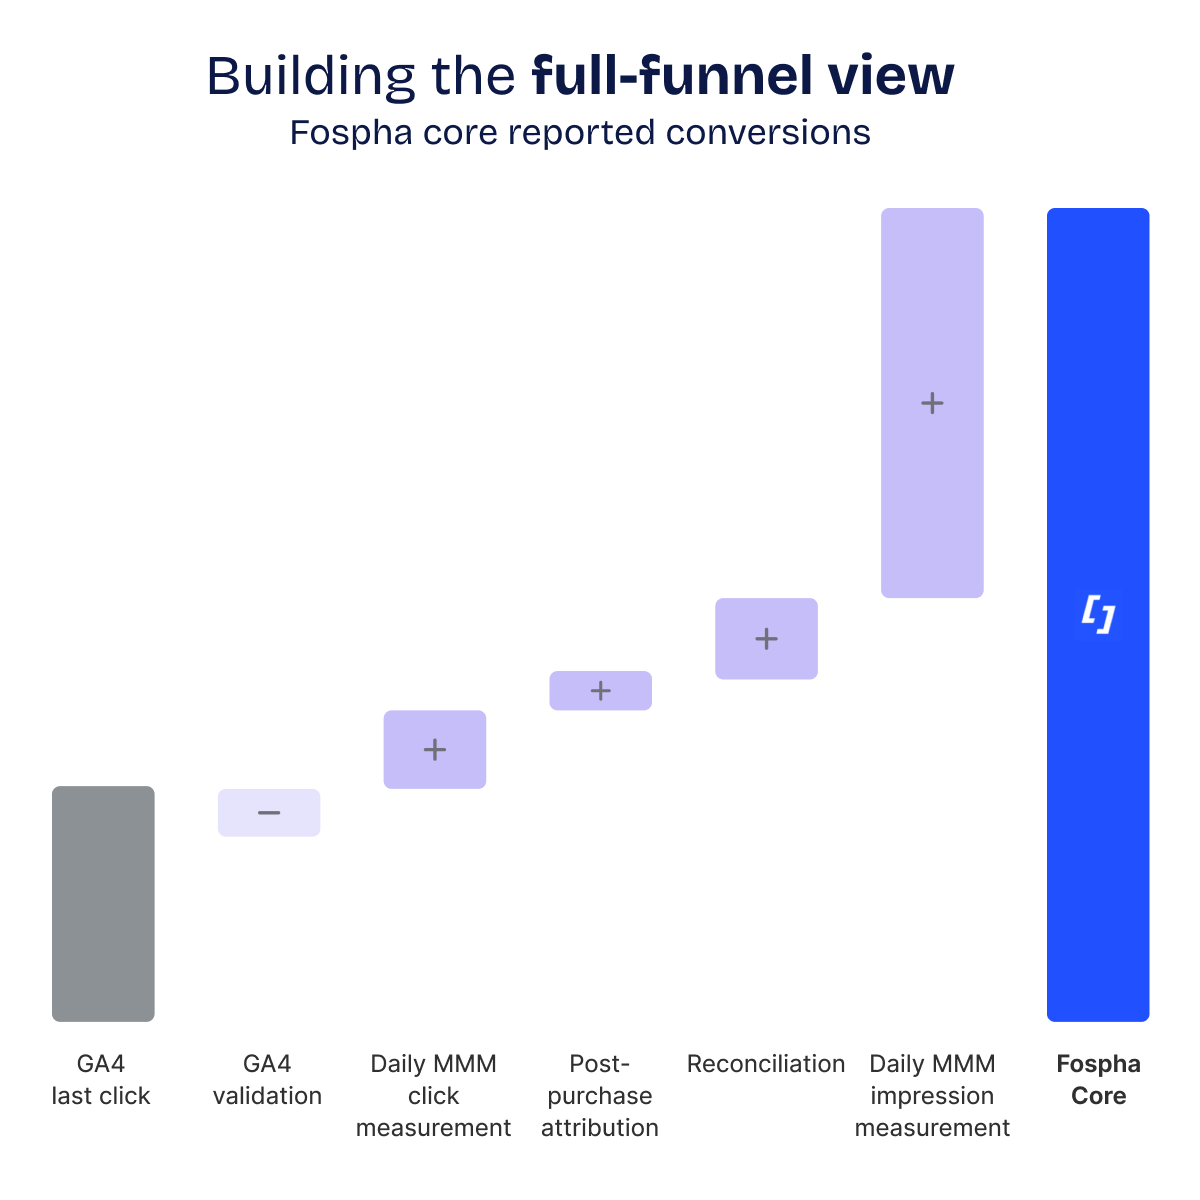
Core
Daily, ad-level measurement that flows directly into the systems that act on it
Spend smarter, grow faster. Fospha's always-on Daily MMM provides tools for all teams - from CMO to channel manager.
Measure and quantify the impact of every impression, view, and click from campaign down to ad-level, across all your sales channels like DTC, Amazon, and TikTok Shop. Fospha delivers strategic insights daily to help brands optimize for short and long-term efficiency.
Beam
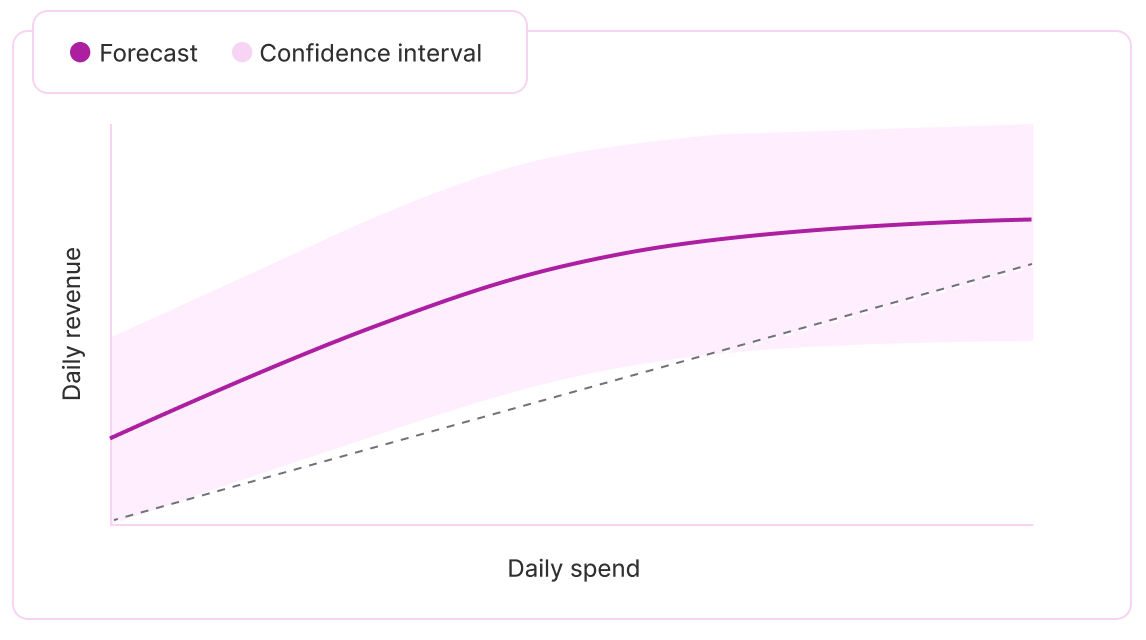
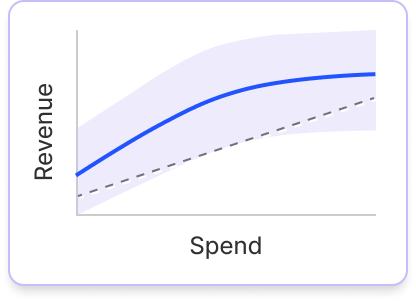
Know your next best dollar — forecast incremental returns
Identify and harness opportunities for profitable growth with Bayesian saturation curves for every channel and objective so you can see exactly how far your budget can go before you spend it.
Forecast ROAS and CAC at different investment levels, pinpoint the point of diminishing returns, and maximize the impact of your marketing budget.
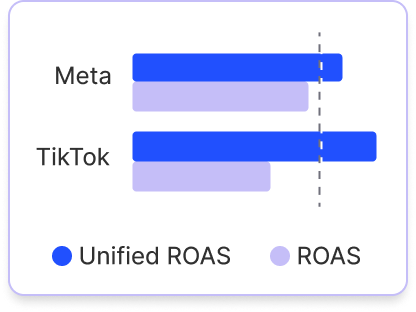
Halo
One system — DTC, Amazon, and TikTok Shop
Measuring the cross-channel halo effect on marketplaces is impossible using DTC metrics and tools. Without unified measurement, media budgets miss crucial marketplace revenue.
Halo leverages incremental forecasting models to measure how your paid media drives sales across Amazon, TikTok Shop, and retail marketplaces. Optimize marketplace performance and drive profitable growth.

Prism
Turn measurement into automated action
Prism delivers incremental growth at scale, especially in channels and markets that get deprioritized when teams are stretched.
Budget changes reflect the full cross-channel impact of your marketing, not just ad platform reporting, so spend never shifts based on silo’d signals.
Channel efficiency improves automatically — Prism reduces budgets when performance drops, so no dollar stays in an underperforming campaign longer than it should.
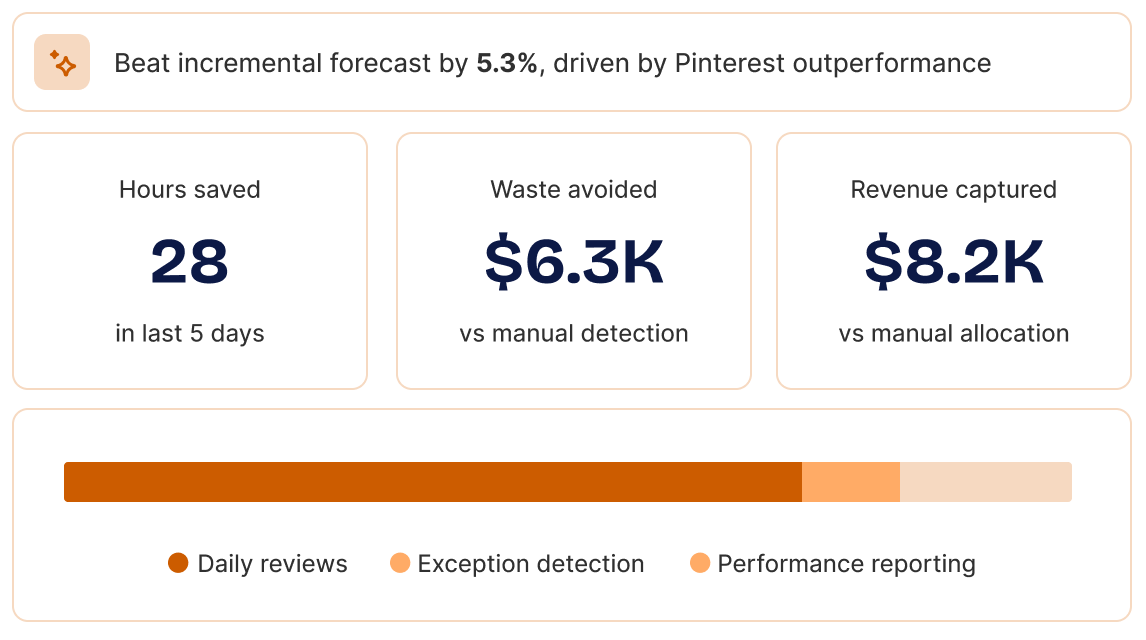
Spark AI
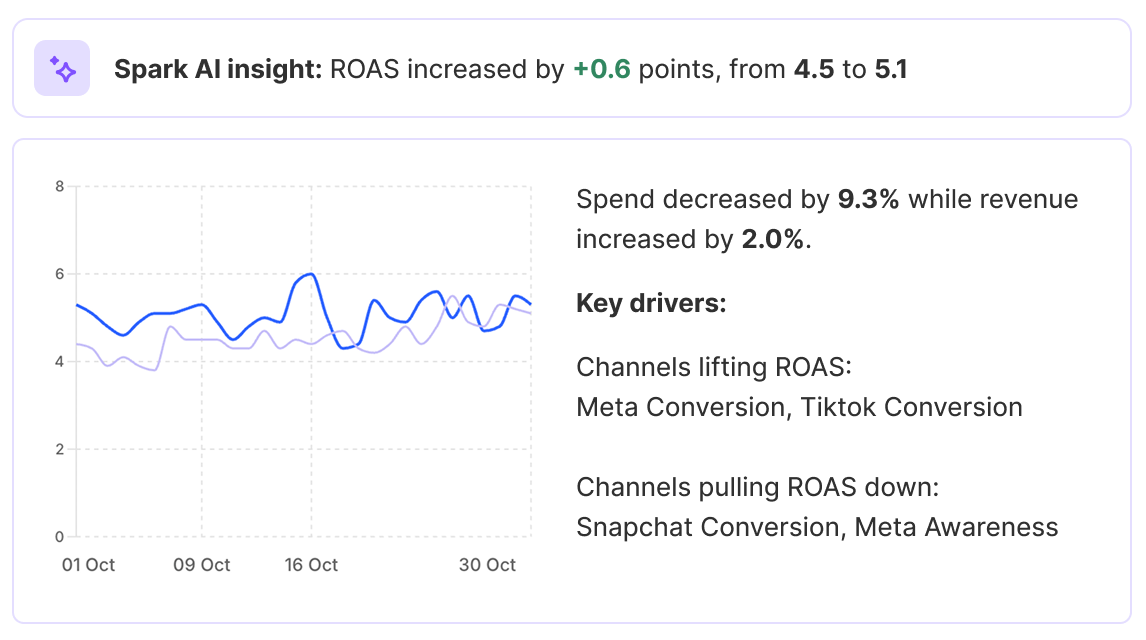
Intelligence that sharpens insight and saves time
Spark AI is Fospha's intelligence layer — designed to get the right data to the right people, faster.
Inside the platform, Ask Fospha surfaces performance shifts, flags optimization opportunities, and handles the analysis jobs that slow marketers and analysts down.
Outside it, Spark connects Fospha's measurement directly to the AI tools your team already uses, like Claude and ChatGPT. Ask a question and get an answer in seconds, using the same data that's in your dashboard. Actionable for everyone, not just the people with a login.
The science that makes trust possible and action inevitable.
Over a decade of R&D, built by the same team using the same methodology that has powered growth for Gymshark, Huel, Dyson, and hundreds of the world's fastest-growing retail brands. The result is a proprietary, always-on measurement system with a Media Mix Model at the core, delivering what legacy tools can't: daily, impression-led, full-funnel measurement that is transparent, validated, and ready to power automation.
End-to-end. Every team. Every decision. Driving incremental outcomes, every day.
Our Measurement OS unites Finance, Marketing, Data, and Leadership with a shared view of performance and profitability — combining daily measurement, forecasting, and optimization.
Maximize the impact of your marketing budget
See the true impact of all your marketing activity across every sales channel, pinpoint where you have room to grow profitably, and make the most of every dollar in your marketing budget

Understand your true marketing ROI for smarter spending
With Fospha, see the true ROI of all your channels, make smarter budget decisions, and escape the bottom-of-funnel trap.
With automatic, customized reporting directly in your inbox, monitoring the metrics that matter has never been easier.

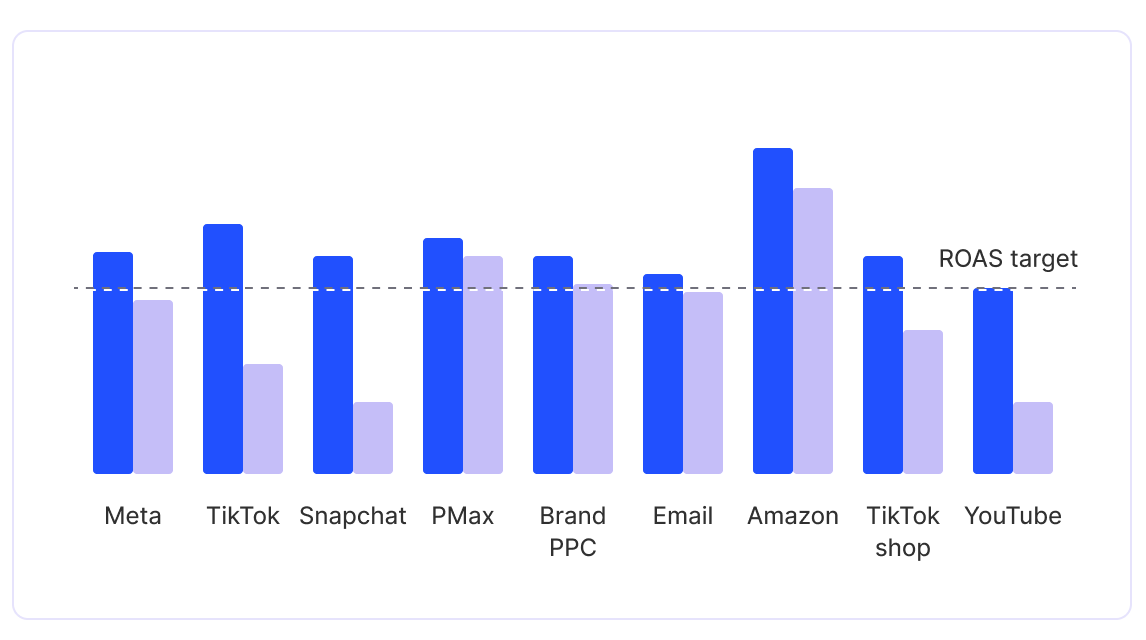
Prove True Channel Impact, Optimize Every Dollar
Instantly spot trends in your data, course-correct quickly, and identify both oversaturated campaigns and top performers with headroom to scale.
Maximize performance and make the most of every dollar in your channel budget.

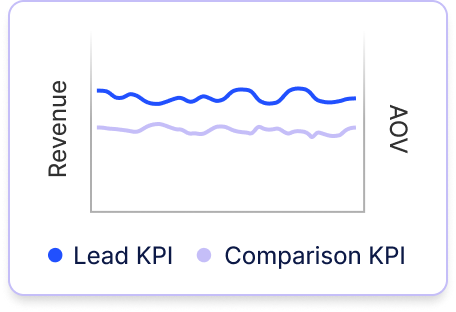
Prove the business impact of brand. Secure future growth
Fospha’s Glow leverages causal reasoning modeling to measure the impact of brand campaigns on the sensitive leading indicators of future performance.
Quantify the impact of brand-building on tangible business outcomes, justify budgets and fuel long-term growth


.avif)
How we embed the Measurement OS
at the heart of your business.
Where evolved measurement enables strategic planning, team alignment, and execution.
1. Data validation
2. Total measurement visibility & growth planning
You gain access to our enterprise-grade model we've pressure-tested across hundreds of retailers. Always-on media mix modeling. Daily training. Ad-level granularity.
This provides both upper and lower funnel visibility, revealing the true impact of your marketing strategy and enables us to develop a mutual success plan that balances short-term wins with long-term sustainable growth.
3. Change management & adoption
We help unite marketing and finance teams around a shared source of truth, facilitating the transition to a new view of measurement. Through regular training sessions, reporting workflows, and optimization insights, we ensure everyone understands the value of daily measurement and can confidently act on the data.
4. Continuous learning
& growth
By connecting Fospha to your tools and workflows, teams across your organisation—from CMO to channel managers—can make smarter, more confident budget decisions that fuel profitable growth.
Hundreds of leading retail brands trust Fospha's Measurement OS


.webp)


Stay ahead with the inside scoop from Fospha.
For over 10 years, we've been leading the change in marketing measurement.


.png)


.png)
.png)
.png)
.png)
.png)
.png)
.png)
.png)
.png)
.png)
.png)
.png)
.png)
.webp)


.webp)
.webp)
.png)
.webp)

.png)


FAQs
The short answer
Model accuracy in a marketing mix model is not a single number - it is a framework of complementary signals evaluated continuously. The three core components are nRMSE (Normalized Root Mean Squared Error), which measures predictive error; R², which reflects how well the model explains historical variance; and back-testing, which validates at key checkpoints whether the model generalizes reliably to data it has not seen. No single metric is sufficient on its own. Used together, and monitored over time rather than at a single point, they give a robust and transparent picture of model performance.
Marketing mix models guide some of the largest budget decisions a performance team will make. The natural question follows: how do you know the model is actually accurate? And how do you make that accuracy visible and verifiable to finance, leadership, and external stakeholders?
Accuracy, properly measured, requires multiple complementary perspectives - different metrics reveal different things about how a model is performing.
Why does measuring model accuracy require more than one metric?
Evaluating a model's accuracy comes down to two distinct questions that pull in different directions.
The first is how well the model learns from historical data - how closely its outputs match the patterns already in the training set. The second is how well it performs on data it has not seen - whether the relationships it has learned hold up in genuinely new periods.
These two questions reflect what is known in statistics as the bias-variance tradeoff. The bias-variance tradeoff is the tension between a model that learns too rigidly from historical data and one that is too loose to be reliable - finding the right balance is central to building models that perform consistently on new data. A model that fits historical data too closely tends to absorb noise rather than meaningful structure - and when the environment shifts, its predictions become unreliable. A model with a slightly imperfect fit on training data can be the more reliable choice if its predictions remain stable on genuinely new periods.
This is why a sound accuracy framework uses both performance metrics, such as nRMSE and R², and out-of-sample validation through back-testing. Each provides a signal the others cannot.
What does each accuracy metric actually measure?
Normalized Root Mean Squared Error (nRMSE) is a measure of predictive error - how closely the model's predictions align with observed outcomes. It is calculated by dividing RMSE by the mean of observed outcomes, which makes the metric comparable across brands and scales. Other normalization conventions exist, such as using the range or standard deviation, so it is worth confirming definitions when comparing providers.
.png)
nRMSE is most usefully read as a trend rather than a single number. A low, stable nRMSE time series is a strong signal of dependable predictive performance. A rising or erratic nRMSE trend may indicate the model is drifting or that the underlying data environment has shifted - a signal worth investigating.
R² represents the proportion of variation in the outcome that the model can explain based on its inputs. A practical way to read it: an R² of 0.90 means the model accounts for roughly 90% of the rises, dips, and shifts in your historical sales data.
R² reflects in-sample fit - how well the model captures patterns in the training data - rather than predictive accuracy on new data. In time-series settings, R² can appear artificially inflated due to trends, seasonality, non-stationarity, or data leakage, so it is best read alongside out-of-sample metrics such as nRMSE. High R² with weak predictive accuracy can indicate over-fitting. Moderate R² with strong predictive accuracy can reflect a well-calibrated model operating in a genuinely complex, noisy environment.
Back-testing is a form of out-of-sample validation that evaluates how well the model generalizes to unseen future periods, preserving the time order of the data. It is typically run at key checkpoints - such as model build or retraining - rather than as a continuously updated signal. At its simplest, it involves comparing model performance between the periods it learned from and the future periods it has not seen. If performance degrades on the unseen periods, it may indicate over-fitting or instability. If performance remains consistent, it suggests the model has learned meaningful structure rather than memorizing historical noise. Back-testing adds a layer of confidence that the model will behave reliably in real-world, forward-facing conditions.
Inside the Glassbox
Accuracy is a continuous discipline at Fospha, not a one-time check. This sits inside Glassbox - Fospha's commitment to full transparency across every modeling layer. Every model layer, validation step, and metric is open to inspection. Customers can see how the ensemble model is constructed, how different measurement components contribute (click measurement, impression measurement, post-purchase, halo), the validation metrics behind every prediction, and the daily, ad-level outputs those decisions rely on.
.png)
In practice, each modeling cycle follows a structured loop: data refresh and retraining; evaluation on held-out periods to assess generalization; ongoing monitoring of nRMSE and R² to track predictive error, model fit, and stability over time; and transparent reporting, with accuracy measures available to customers on request.
nRMSE is computed daily for every model Fospha runs, including click-based components and impression-based MMM, so performance is continuously visible. Accuracy metrics are available to customers on request and typically shared via their CSM, complete with plain-English definitions and guidance, so model health is straightforward to understand and verify without requiring statistical expertise.
Healthy accuracy ranges are brand-specific and derived empirically. The goal is not a single universal benchmark, but a stable band for each brand that signals the model is learning meaningful structure and generalizing reliably over time.
Common questions
Q: What is a good nRMSE score for a marketing mix model?
There is no universal benchmark - healthy nRMSE ranges are brand-specific and derived empirically based on the data environment and business context. The more useful signal is the trend over time: a low, stable nRMSE series indicates dependable predictive performance, while a rising or volatile trend warrants investigation. A single low score at one point in time is less informative than consistent stability across many measurement periods.
Q: Can R² alone tell me if my MMM is accurate?
No. R² reflects in-sample fit - how well the model explains historical patterns - but it does not tell you whether those relationships will hold on new data. In time-series settings, R² can be artificially inflated by trends, seasonality, non-stationarity, or data leakage. A high R² alongside weak out-of-sample performance is a sign of over-fitting. R² is best read alongside predictive accuracy metrics such as nRMSE and validated through back-testing.
Q: What is back-testing and why does it matter for MMM?
Back-testing is out-of-sample validation that checks whether a model generalizes beyond the data it was trained on. It works by evaluating model performance on future periods the model has not seen, preserving the time order of the data. If performance degrades significantly on those unseen periods compared to the training period, it may suggest the model has over-fitted to historical noise. Consistent performance across both periods is a positive indicator that the model has learned genuine, stable structure - and is more likely to produce reliable outputs in real-world conditions.
Q: How often should model accuracy be monitored?
Continuous monitoring is more reliable than periodic checks. Marketing environments shift - media mix changes, spending levels fluctuate, audience behavior evolves. A model calibrated under one set of conditions may drift as those conditions change. Tracking metrics such as nRMSE on a daily basis, rather than waiting for quarterly model refreshes, makes it possible to detect and address emerging issues early.
Related reading
The short answer
A pure Media Mix Model is not designed to evaluate individual creatives - the statistical conditions required for that level of precision rarely exist. But that does not mean creative decisions should be made without full-funnel context. A modern Daily MMM, scoped to the right level and combined with platform-native signals, can provide reliable directional guidance for creative prioritization without overstating what the data can support. The goal is better decisions, not more granular numbers.
Creative is one of the most actively managed levers in paid media. Decisions about which ads to scale, which concepts to cut, and which formats are building demand versus capturing it happen every week, if not daily. The question most performance teams eventually ask is: can our MMM help us make those calls more accurately?
The answer is nuanced, and getting it wrong in either direction creates real problems. Dismiss the question entirely and creative decisions get made on click-based signals that have well-documented limitations which compound over time. Overstate MMM precision at the ad level and the outputs become unstable, eroding the trust the measurement function depends on.
Why does a pure MMM struggle at the individual ad level?
A Media Mix Model (MMM) is a statistical technique that uses aggregated input and outcome data to estimate the contribution of different marketing activities to revenue. It is designed to detect patterns that are visible at the level of channels, objectives, and time periods - not individual ads.
Three structural constraints explain why extending a pure MMM to the creative level tends to produce unreliable outputs.
- Parameter growth. Introducing hundreds or thousands of individual creatives into a model dramatically increases the number of parameters it must estimate. Without enough independent variation in the data to support each parameter, the model becomes unstable - small changes in inputs produce large swings in outputs.
- Correlation within platforms. Creatives within the same platform tend to move together. They share budgets, targeting, auction dynamics, and delivery systems. This makes it statistically difficult to separate the relative contribution of individual ads from aggregate campaign performance.
- Cadence mismatch. Many traditional MMMs refresh on monthly or quarterly cycles. Creative performance changes much faster than that. Insights that arrive six weeks after a campaign has rotated out are not useful for the creative decisions being made today.
For these reasons, applying a pure MMM directly at the ad level is generally not statistically reliable.
Why does full-funnel context still matter for creative decisions?
The limitation of pure MMM at the creative level does not make full-funnel measurement irrelevant to creative decisions. It makes it essential.
Without full-funnel context, creative performance is easy to misread:
- A prospecting video may reduce site conversion rate while actively contributing to broader demand generation. Click-based signals will penalize it; full-funnel measurement will credit it correctly.
- An upper-funnel creative may appear inefficient in platform reporting while influencing downstream revenue across a longer window.
- Two creatives may look similar in-platform yet behave very differently once cross-channel effects are accounted for.
Teams that rely solely on lower-level signals tend to bias their decisions toward demand capture. They optimize toward what is easiest to measure, not what is most effective. The result is a media mix that is typically underweighted toward upper-funnel and demand generation channels.
How does a modern daily MMM approach the ad level?
The answer is a deliberate hybrid, where each signal does the job it is best suited for.
MMM at the level it is strongest. Fospha's Daily MMM focuses cross-channel, full-funnel measurement at the campaign type or objective level across platforms and markets. At this level, there is sufficient independent variation in the data to produce outputs that are stable over time, comparable across channels, and suitable for budget and planning decisions.
Platform signals for finer-grained views. Below the campaign level, the signal changes. Publishers have strong visibility into engagement, delivery, and auction dynamics within their own platforms. Fospha uses these intra-platform signals to allocate campaign-level MMM outputs down to individual ads.
The result is ad-level views that are:
- grounded in cross-channel, full-funnel measurement
- informed by platform-native signals where those signals are most reliable
- consistent enough over short operating windows to support prioritization decisions
These views are designed for decision support, not for precise estimation of individual ad effects. The distinction matters. Decision support tells you which creatives are worth scaling and which should be rotated out, within a frame that reflects total business impact. Precise estimation makes claims about individual ad contribution that the data simply cannot support at that resolution.
How Fospha's Core separates measurement from allocation
Fospha's Core, the always-on Daily MMM, addresses this by clearly separating where measurement is most reliable from where allocation and prioritization are more appropriate.
At the campaign type and objective level, Core provides cross-channel, full-funnel measurement with the statistical stability needed to inform budget decisions. This is the frame teams use to understand whether their creative investment is building demand or primarily capturing existing intent.
At the ad level, Core allocates campaign-level measurement outputs using platform-native signals, producing directional views that are grounded in full-funnel context without overstating precision. A creative that looks inefficient in last-click reporting gets evaluated in the context of what the MMM shows is happening across the full channel path.
The practical outcome is that creative teams can make rotation, scaling, and investment decisions with more than just in-platform data behind them, and with less risk of undervaluing the upper-funnel formats that drive long-term growth.
Common questions
Q: If MMM can't precisely measure individual ads, does that mean ad-level data from an MMM is unreliable?
Ad-level outputs from a well-designed hybrid MMM are reliable for directional decisions, but they should not be treated as precise point estimates of individual ad contribution. The appropriate use is prioritization and rotation decisions within a full-funnel frame, not granular performance measurement at the creative level. The distinction between decision support and precise estimation is what makes the outputs trustworthy.
Q: What happens if a team relies only on platform signals for creative decisions?
Platform signals are useful for understanding delivery dynamics and in-platform engagement, but they have predictable blind spots. They bias decision-making toward demand capture - the bottom-funnel activity that is easiest to observe. Upper-funnel and prospecting creatives are typically undervalued. Teams that rely heavily on these signals risk improving in-platform metrics while reducing broader marketing efficiency, particularly if upper-funnel spend is cut in the process.
Q: How often does ad-level measurement need to update to be useful for creative decisions?
Creative performance changes quickly - campaigns rotate, budgets shift, auction dynamics evolve week to week. Measurement that refreshes quarterly arrives too late to inform the decisions that have already been made. Daily MMM updates, which are standard in Fospha's Core, close the gap between when something changes in the media mix and when measurement reflects it. For creative decisions, daily cadence is the difference between acting on current data and optimizing against a picture that is already out of date.
Yes. Fospha MCP connects your Fospha measurement directly to AI tools like Claude and ChatGPT - so you can ask questions about your performance data in plain language and get answers back in seconds, using the same data that's in your Fospha dashboard. No login required.
MCP works with Claude and Cursor today, with ChatGPT and Perplexity coming next. You'll need an enterprise AI account (Claude for Work, ChatGPT Enterprise, or equivalent) to connect it.
Speak to your account manager to get set up.
Getting started with Fospha is quick and painless—most of our clients are up and running in less than 28 days with minimal effort.
All we need is admin access to your ad accounts, Google Analytics, and eCommerce platform—no coding or IT department needed!
Here's how it works:
- Initial Setup (about 3 hours): We'll help you connect your data through our easy-to-use onboarding portal.
- Data Validation (1-2 weeks): We'll verify your connections while you review initial insights for accuracy.
- Go-Live (by Day 28): You're all set! Full platform access with 24 months of historical data immediately available.
Your team includes an Onboarding Specialist for setup, a Customer Success Coordinator for ongoing support, and an Account Manager to help turn insights into growth opportunities
Fospha delivers the fastest time-to-value in marketing measurement, with most clients fully live in under 28 days.
Your onboarding timeline:
- Setup (3 hours): Connect your ad platforms, GA4, and eCommerce data via our easy-to-use Onboarding Portal.
- Data Validation (1-2 weeks): We reconcile and verify your data for accuracy, ensuring seamless measurement.
- Go-Live (by Day 28): Access 24 months of historical data from day one and start optimizing your performance immediately.
We take accuracy seriously. Our model undergoes daily quality checks to ensure reliable, fair measurement you can trust. Here's how we ensure accuracy:
- Data Validation First: Before anything enters our model, we verify your tracking is consistent across platforms, identify any gaps between channels, and run daily checks to confirm outputs align with expected patterns.
- Historical Back-Testing: We prove our value by showing how our model would have accurately predicted your past performance trends, giving you confidence our recommendations are reliable.
- Outlier Capping: During major sales events like Black Friday, ad platforms typically over-claim credit. Our system automatically adjusts the outputs on high-traffic days to maintain a fair picture of what's really driving results.
Yes, Fospha is built for privacy-first measurement, today and in the future.
For 10+ years, we've led the shift away from pixel-based tracking, building our solution to meet global privacy standards like GDPR, CCPA, and iOS14+, and preparing for changes like Google’s Privacy Sandbox.
Here’s how we do it:
No third-party cookies or user-level tracking: Our model doesn’t rely on personal identifiers or outdated tracking methods
- Privacy-first by design: Fospha combines always-on measurement signal with Daily MMM to restore visibility lost to privacy changes—without compromising compliance
- Proven compliance: Trusted by global brands across the US, UK, and EU, Fospha meets the highest privacy standards
Fospha uniquely combines the best of both worlds by unifying always-on measurement signal with Daily MMM - something our competitors simply don't offer.
While platform-native dashboards miss upper-funnel impact due to signal loss, and traditional MMM lacks the speed and granularity for daily decisions, we deliver:
- The granular, ad-level measurement insights for tactical optimization
- The predictive power and total channel visibility of our Daily MMM, fairly crediting both demand generation and capture channels
Our unified approach, refined through 10+ years of working with hundreds of brands, corrects the common measurement bias toward last-touch channels - properly valuing the complete channel mix from awareness to conversion.
Fospha measures your entire channel mix, from brand awareness to conversions, giving every channel fair credit using privacy-safe Daily MMM.
We cover everything that drives growth - across web, app, and Amazon - and unify it into a single, unbiased view.
What sets us apart:
- Halo Effect: Reveal how Meta, TikTok, and Google ads drive sales on Amazon - with unified ROAS across DTC and marketplace
- TikTok Shop: Track in-app and on-site purchases together, giving you full visibility into TikTok performance beyond what Google Analytics can capture
- App Sales: We model app and web sales separately to reflect how customers behave on each platform
With Fospha, you measure what matters - no blind spots, no wasted budget, just smarter growth.
Immediately.
Fospha gives you full-funnel, privacy-safe measurement from day one—so you can optimize spend, measure true channel impact, and make smarter decisions faster. Here's how different teams benefit from Fospha from day 1:
For Performance Marketers & Growth Teams:
- Stop wasted spend & scale smarter – Use Spend Strategist to forecast ROAS, conversions, and revenue at different spend levels—helping you scale efficiently.
- Optimize within & across channels – Get ad-level insights to improve performance and shift budgets strategically, even when direct reallocations aren’t possible.
For Marketing & Finance Leaders:
- Confident, bias-free reporting – Move beyond last-click limitations with independent, privacy-safe measurement trusted by CMOs and CFOs.
- Smarter budget decisions – Use Spend Strategist to forecast the most efficient spend levels before committing budget.
- See the full impact of marketing – Get daily, MMM-powered insights that quantify brand-building and performance marketing together.
No blind spots, no wasted budget - just better decisions from the very start.